Table of Contents
Sales performance metrics: the practical definition
Sales performance metrics are defined measures used to understand commercial results, opportunity development, customer coverage, representative execution and process quality. A key performance indicator, or KPI, is a metric selected as critical to a specific objective and management decision.
Every metric should have:
- a business question and decision owner;
- an exact formula;
- a population and exclusions;
- a time window and comparison period;
- an authoritative source and refresh cadence;
- a response when the value is unusual;
- known limitations and gaming risks.
Without those definitions, two dashboards can display the same label and calculate different facts.
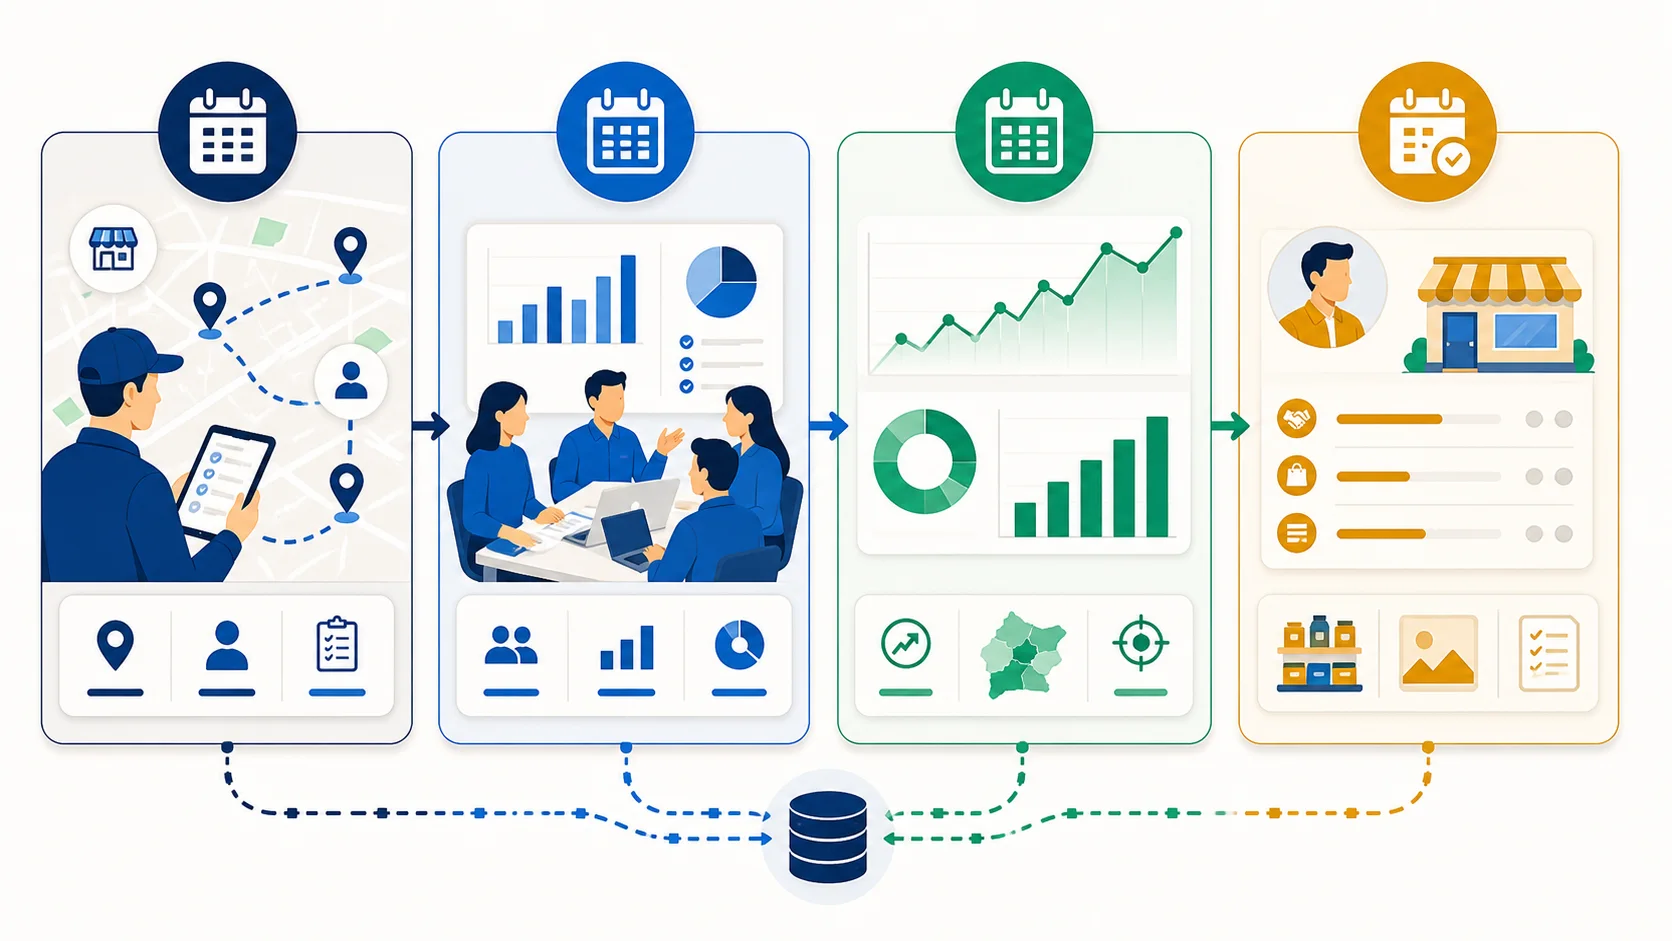
Build a balanced sales measurement system
Do not manage a representative with revenue alone. Revenue is important but can reflect inherited accounts, price changes, supply, territory potential and sales-cycle timing. Combine four layers.
1. Commercial outcomes
Revenue, gross margin, orders, collections where relevant, new accounts, retained accounts, distribution and closed business show the result.
2. Pipeline and leading evidence
Qualified opportunities, stage conversion, next actions, pipeline coverage and ageing show the uncertain work that may produce later results.
3. Field execution and customer coverage
Required calls, productive visits, priority-account coverage, order value per visit, merchandising outcomes and overdue follow-up show how scarce field time is used.
4. Quality and control
Order errors, missing data, sync failures, unresolved exceptions, forecast variance and return or cancellation patterns show whether the process is reliable.
A team should normally highlight a small set of KPIs and keep diagnostic metrics behind them. If everything is “key,” managers cannot prioritise.
Revenue and sales growth
Revenue = sum of eligible recognised sales value for the period
State whether the source is orders, invoices or recognised revenue and whether values include VAT, freight, discounts, credit notes and currency conversion. Orders and revenue are not synonyms.
Sales growth % = (current-period value − prior comparable value) ÷ prior comparable value × 100
Handle a zero prior period explicitly. Compare like periods and disclose changes in price, territory, acquisition, closures or data coverage.
Growth can be decomposed by new customers, retained customers, price, volume, product mix and churn. This turns a headline into possible actions.
Gross margin and margin percentage
Gross margin amount = eligible revenue − approved cost of goods sold
Gross margin % = gross margin amount ÷ eligible revenue × 100
Use finance-controlled cost definitions. Margin may change after credits, rebates or cost updates. Restrict sensitive product or customer margin data to appropriate roles.
Revenue growth with deteriorating margin may not be healthy. Conversely, a representative may have limited control over central price or cost decisions, so use margin for informed discussion rather than automatic blame.
Target attainment
Target attainment % = actual eligible result ÷ approved target × 100
Targets need period, measure, currency, territory and version. Preserve changes and effective dates. A zero or missing target is a data exception.
Review attainability across territories using potential, workload, inherited pipeline and supply conditions. A clean formula does not make a poor target fair.
Average order value
Average order value = eligible order value ÷ number of eligible orders
Define whether cancelled, zero-value, duplicate, test and return transactions are excluded. Use the same order identity in numerator and denominator.
A rising average can reflect better range selling, price inflation, fewer small customers or a changed order cadence. Inspect lines per order, customers ordering and frequency before deciding what caused it.
Sales conversion rate
Conversion rate = successful eligible outcomes ÷ eligible opportunities or attempts × 100
The denominator must match the sales motion. Possible versions include:
- leads converted to qualified opportunities;
- qualified opportunities converted to won;
- proposals accepted;
- completed visits producing an order;
- contacted eligible prospects becoming customers.
Do not combine these into one unlabeled “conversion.” Define when an opportunity enters the cohort and whether the calculation is event-based or cohort-based. Short windows can understate long sales cycles.
Win rate
Win rate = won opportunities ÷ closed won plus closed lost opportunities × 100
Exclude open opportunities from a closed-outcome win rate. Require controlled loss reasons and avoid closing weak prospects as “lost” merely to improve pipeline hygiene without useful evidence.
Review win rate by segment, source, product, deal size and stage reached. A high win rate may signal excellent qualification or an overly narrow pipeline.
Pipeline coverage
Pipeline coverage = qualified open pipeline for the target window ÷ remaining target for that window
State whether pipeline value is unweighted, weighted or forecast-category based. Coverage is not a universal benchmark; required levels depend on win rate, timing, deal concentration and data quality.
Remove duplicates and clearly late opportunities. Separate committed, best-case and earlier-stage views rather than applying one arbitrary probability to everything.
Pipeline velocity
A common conceptual formula is:
Velocity = opportunity count × average deal value × win rate ÷ average sales-cycle length
The result is sensitive to cohort choice and outliers. Use consistent eligible opportunities and consider medians for cycle length and value diagnostics. Velocity helps compare a stable process over time; it is not guaranteed future revenue.
Forecast accuracy and bias
Forecast error % = absolute value of forecast − actual ÷ actual × 100
Forecast bias = forecast − actual
Accuracy shows magnitude; bias shows systematic over- or under-forecasting. Preserve dated forecast cuts so the team cannot edit last month’s forecast after seeing actuals.
When actual is zero, report the absolute difference and exception rather than dividing by zero. Analyse timing movement separately from deals lost or values changed.
New and retained customers
Define “new” against a lookback period and stable customer ID. A duplicate account must not appear as a new win.
Customer retention % = customers active at the start who remain active at the end ÷ eligible starting customers × 100
State what “active” means: any order, qualifying revenue, contract status or another rule. Gross revenue retention and logo retention answer different questions.
In recurring field sales, also track reactivated dormant accounts and priority customers with no qualifying contact or order.
Visit and coverage KPIs for field sales
Planned versus completed visits
Visit completion % = qualifying completed planned visits ÷ eligible planned visits × 100
Preserve cancelled, rescheduled, inaccessible and manager-changed reasons. A route change can be legitimate.
Productive visits
Define an outcome appropriate to the role: accepted order, qualified next step, resolved merchandising task, completed assessment or meaningful customer decision.
Productive visit rate = productive completed visits ÷ eligible completed visits × 100
A check-in alone should not qualify.
Account coverage
Account coverage = eligible accounts with a qualifying contact ÷ eligible accounts × 100
This differs from required-call completion. One contact may cover an account but fail its required monthly frequency.
Required-call completion
Required-call completion = completed due contacts ÷ required contacts due × 100
Review by account segment so repeated low-priority calls do not hide missed strategic coverage.
Order value per productive visit
This can connect field effort to orders, but timing and role matter. A technical visit may advance a large future opportunity without an immediate order. Use it for relevant recurring-order motions.
Route-efficiency metrics
Potential measures include distance per productive visit, travel time as a share of field time, planned-versus-actual stop sequence, stops within customer windows and overtime.
Efficiency should be constrained by customer priority, service quality, breaks and safe travel. Rewarding calls per day without visit purpose encourages short, convenient calls. Never design an incentive that promotes unsafe driving or device use.
Route data is diagnostic. A long route may be a territory-design problem, not a representative performance problem.
Sales activity metrics and their limits
Calls, emails, meetings, proposals and tasks can help diagnose effort and process. They are easy to overvalue and game.
Ask:
- Does the activity represent a meaningful event?
- Can the same event be counted twice across tools?
- Is more always better?
- Does the representative control it?
- What quality or outcome should accompany it?
- What decision changes when the number moves?
Avoid universal activity quotas when account value, territory density and sales cycle differ. Use activity to understand a result and coach the process.
Data-quality KPIs
Reliable reporting needs its own measures:
- required-field completeness;
- duplicate customer, opportunity or order rate;
- invalid identifier and mapping exceptions;
- late entry or sync rate;
- rejected order or integration rate;
- overdue next actions;
- stale opportunity rate;
- unknown loss or audit reason rate;
- reconciliation difference;
- report freshness.
Do not convert missing values to zero when zero has a business meaning. Missing, not applicable and zero are distinct states.
Leading versus lagging indicators
Lagging measures describe completed outcomes: revenue, margin, wins and retention. Leading indicators describe conditions or work that may influence future outcomes: qualified pipeline, due coverage, next-action discipline and product distribution.
A leading measure is useful only when evidence shows a plausible relationship and the team can act on it. Raw email volume is not automatically a leading indicator of sales.
Use leading signals for coaching and intervention, then test whether they predict the desired result by segment and role.
Metric windows and cohorts
Choose the time model deliberately.
Period-based metrics count events that happened inside a period, such as invoices this month.
Cohort metrics follow records that entered at a defined time, such as leads created in January and their eventual conversion.
Snapshot metrics describe state at a specific cut, such as open pipeline on the last working day.
Rolling metrics smooth a moving window, such as trailing 90-day conversion.
Label the model. Mixing current pipeline snapshots with historic revenue periods creates misleading ratios.
Role-specific KPI sets
Recurring territory representative
Revenue or margin, target attainment, priority coverage, productive visit rate, order value, distribution, overdue follow-up and order quality.
New-business field representative
Qualified opportunities, meetings with target accounts, stage conversion, proposal quality, win rate, cycle time, pipeline coverage and new revenue.
Retail merchandiser
Eligible outlet coverage, availability, planogram or promotion compliance, authorised correction, exception closure and evidence quality.
Van sales representative
Sales or margin, route coverage, product distribution, vehicle-stock variance, returns by reason, collections reconciliation and rejected documents.
Field sales manager
Team target result, territory balance, forecast bias, priority exception closure, coaching actions, data quality and sustainable productivity.
Use comparable metrics only for genuinely comparable roles.
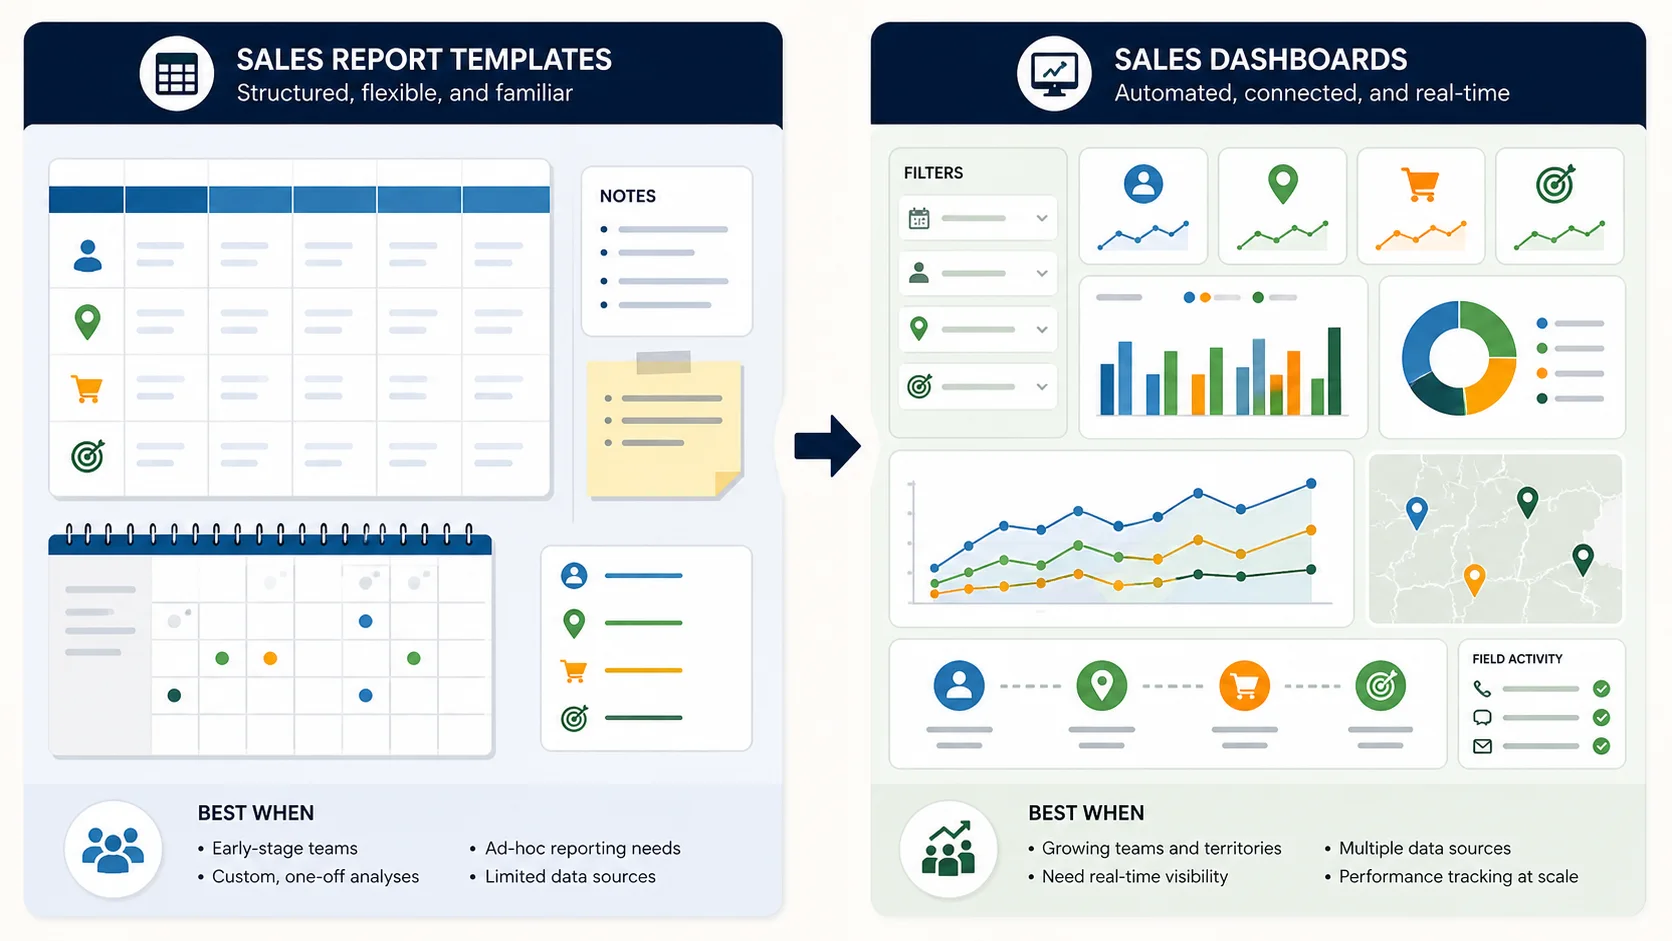
Dashboard design for decisions
Place the small KPI set at the top with current value, target or comparison, definition access, refresh status and material exception. Provide filters that preserve the denominator.
Use diagnostic layers:
- company or team outcome;
- territory, segment or product decomposition;
- exception list requiring action;
- underlying record for verification.
Every red indicator should suggest an owner and next question. Do not use colour alone; include labels and accessible contrast.
Managers need counts as well as percentages. A 50% conversion rate from two opportunities is not the same evidence as 50% from 200.
Review cadence
Daily: urgent order, customer, route and integration exceptions.
Weekly: priority coverage, next actions, pipeline changes, conversion diagnostics, coaching and blockers.
Monthly: reconciled revenue or margin, target attainment, forecast back-testing, territory patterns and data quality.
Quarterly: segmentation, territory capacity, KPI usefulness, incentive side effects and target assumptions.
Freeze snapshots where back-testing matters. Record decisions, owners and due dates.
Avoid vanity metrics and gaming
People adapt to measures. Before adopting a KPI, imagine how someone could improve it without improving the business.
- visit count rises through short low-value calls;
- conversion rises by excluding difficult prospects;
- pipeline grows through duplicate or weak opportunities;
- average order value rises while smaller customers are ignored;
- compliance rises through excessive N/A answers;
- follow-up completion rises through meaningless task closure;
- route efficiency rises while priority accounts are skipped.
Pair metrics with safeguards, inspect samples and avoid automatic high-impact judgements from one number.
Performance management and responsible use
Dashboards support questions; they do not replace fair process, context or qualified HR and legal guidance. Communicate definitions, use consistent evidence, allow correction of data errors and distinguish factors inside and outside a representative’s control.
Location and activity monitoring should be proportionate to a defined purpose. Apply suitable access, retention and POPIA controls. Avoid broad public leaderboards that expose sensitive performance without a justified need.
Implementation plan
Step 1: start with decisions
List the recurring decisions made by executives, managers and representatives. Retire measures no one uses.
Step 2: write a metric dictionary
For each metric, document formula, source, field definitions, population, exclusions, window, refresh, owner and limitation.
Step 3: reconcile the baseline
Reproduce recent values from authoritative sources and explain differences between existing reports.
Step 4: choose a small KPI set
Balance outcome, leading, execution and quality measures by role. Define response thresholds carefully.
Step 5: build exception-first views
Let managers move from the number to the records and actions that require attention.
Step 6: pilot the review cadence
Use the dashboard in real meetings, record decisions and remove measures that create debate without action.
Step 7: audit side effects
Look for gaming, unfair comparison, data gaps, excessive monitoring and behaviours that conflict with customer value.
Questions decision-makers should ask
Sales leaders: Which outcomes and leading conditions define a healthy motion, and are territories comparable?
Managers: What decision follows this metric, which records explain it and what support can I provide?
Representatives: Is the formula visible, the data correct and the measure relevant to work I can influence?
Finance: Do revenue, margin, targets and commissions reconcile with approved sources and periods?
CTO, CIO and data teams: Where is each metric computed, how is lineage tested, which role can export it and how are stale or failed data marked?
HR and legal advisers: Is performance evidence used consistently, proportionately and under an appropriate process?
Executives: Is the dashboard improving decisions or merely increasing the number of charts reviewed?
Final metric-quality test
Select any KPI. Reproduce it from named records using the published formula. Explain the denominator, period, exclusions and refresh time. Identify the management action and a plausible way the measure could be gamed. Then compare the action with a balanced companion measure.
If those answers are unavailable, the number is not ready to manage performance. When they are available, sales metrics become a shared language for diagnosis, coaching and accountable improvement.