Real-Time Data
Highly Rated

Best Sales Performance Dashboard
in South Africa

Transform your sales performance with real-time analytics, custom reports, and actionable insights. Make data-driven decisions that boost results by 40%.

40% Better Results
Real-Time Insights
Custom Reports
Smart Alerts
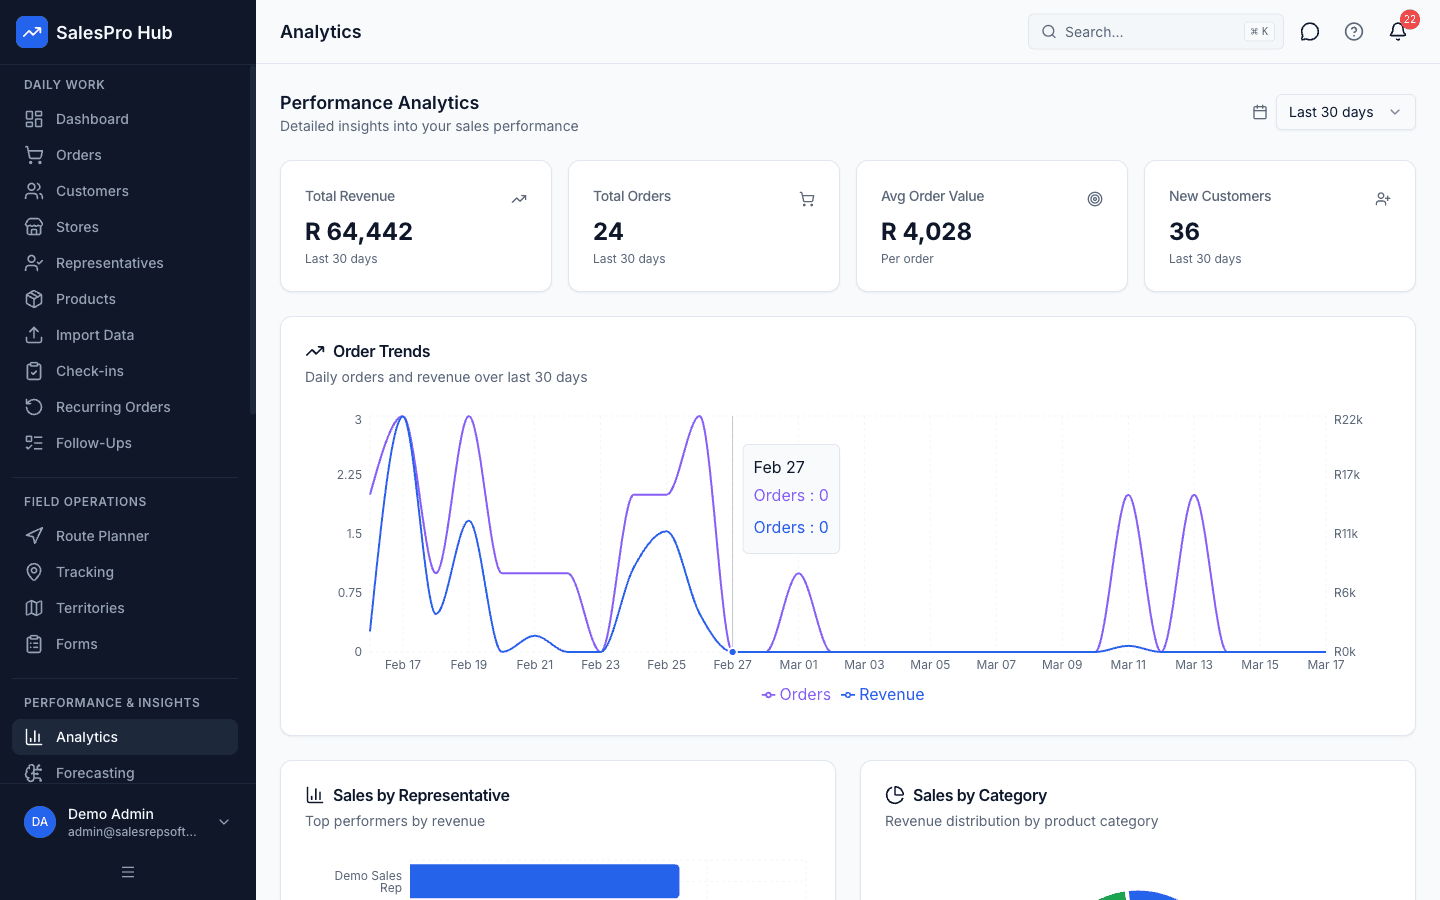
SalesPro Hub sales performance dashboard showing real-time analytics and KPI tracking
Key Benefits

Transform Your Sales Performance with Data-Driven Insights

Get complete visibility into your sales performance with real-time analytics, custom dashboards, and actionable insights that drive results.

Increase sales performance by 40% with data insights
Real-time visibility into all sales activities
Identify top performers and best practices
Spot trends and opportunities early
Make data-driven decisions with confidence
Custom dashboards for every role and need
40%
Performance Boost
Real-Time
Data Updates
100%
Customizable
24/7
Monitoring
Powerful Features

Complete Sales Analytics Solution

Everything you need to track, analyze, and optimize your sales performance with advanced analytics and reporting.

Real-Time Analytics
Monitor sales performance with live data updates, instant KPI tracking, and real-time visibility into your team's activities and results.
Live data updates
Instant KPI tracking
Real-time visibility
KPI Tracking
Track key performance indicators including revenue, conversion rates, pipeline health, and individual rep performance metrics.
Revenue tracking
Conversion metrics
Pipeline analysis
Custom Reports
Create personalized reports and dashboards tailored to your business needs with drag-and-drop customization and automated scheduling.
Custom dashboards
Automated reports
Drag-and-drop builder
Trend Analysis
Identify patterns and trends in your sales data with historical analysis, forecasting, and predictive insights for better planning.
Historical analysis
Sales forecasting
Predictive insights
Team Performance
Compare individual and team performance with leaderboards, benchmarking, and detailed performance breakdowns by rep and territory.
Performance leaderboards
Team comparisons
Territory analysis
Smart Alerts
Receive automated notifications for important events like missed targets, pipeline changes, and performance anomalies.
Automated alerts
Target notifications
Performance warnings
Customer Success

Trusted by Sales Leaders Across South Africa

See how our sales performance dashboard has improved decision-making and results for companies like yours.

"The dashboard has transformed how we manage our sales team. We can spot performance issues early, celebrate wins in real-time, and make strategic decisions based on actual data rather than gut feel."
Mark Stevens
Sales Director
Technology Solutions
"Having real-time visibility into our pipeline and performance metrics has been game-changing. Our weekly sales meetings are now focused on actionable insights rather than just reporting numbers."
Linda Mbeki
VP of Sales
Manufacturing Company
"The custom reports and automated alerts keep me informed of everything happening across my territory. I can coach reps more effectively and ensure we're always on track to hit our targets."
Andrew Wilson
Regional Manager
Distribution Business
Pricing

Simple, Transparent Pricing

Monthly base fee plus a per-user fee. All prices in ZAR, with 15% VAT shown separately where applicable.

Starter

Perfect for small sales teams getting started

R999/mo base

+ R349/user/month

  • Up to 5 sales reps
  • GPS check-ins & team tracking
  • Mobile order capture
  • Customer & product management
  • Basic reporting
  • Email support
Most Popular
Professional

For growing teams that need more power

R1 999/mo base

+ R499/user/month

  • Up to 25 sales reps
  • Everything in Starter, plus:
  • Commission automation & payroll
  • Territory management
  • Recurring orders for regular accounts
  • E-signatures & proof of delivery
  • Sales gamification & leaderboards
  • AI sales forecasting
  • API access & webhooks
  • Data export (CSV/PDF)
  • Company logo & invoice branding
Enterprise

For large teams with complex needs

R4 999/mo base

+ R699/user/month

  • Unlimited sales reps
  • Everything in Professional, plus:
  • Managed ERP & accounting integrations
  • Remote connector monitoring & recovery
  • Priority support & dedicated account manager
  • Custom branding on invoices & portal
  • Advanced analytics & custom reports
  • SLA guarantees
  • Custom training & onboarding

14-Day Trial

Test the Professional workflow without a credit card

Annual Discount

Pay annually and get 2 months free (save 17%)

Cancel Anytime

Review the current subscription terms before purchase

Need a custom quote for a larger team?

FAQ

Frequently Asked Questions

Everything you need to know about our sales performance dashboard.

What is a sales performance dashboard and why do I need one?
A sales performance dashboard is a visual interface that displays key sales metrics, KPIs, and analytics in real-time. It helps you monitor team performance, identify trends, spot opportunities, and make data-driven decisions to improve sales results.
Can I customize the dashboard for my specific business needs?
Absolutely! Our sales performance dashboard is fully customizable. You can choose which metrics to display, create custom reports, set up automated alerts, and configure the layout to match your business requirements and preferences.
Does the dashboard provide real-time data updates?
Yes, our dashboard provides real-time data updates so you always have the most current information. Sales data, performance metrics, and KPIs are automatically refreshed to ensure you're making decisions based on the latest information.
What types of sales reports can I generate?
You can generate various reports including individual rep performance, team comparisons, territory analysis, product performance, revenue forecasts, conversion rates, and custom reports based on your specific metrics and time periods.
Can multiple team members access the dashboard?
Yes, our dashboard supports multiple users with different access levels. Sales reps can view their individual performance, managers can see team metrics, and executives can access company-wide analytics. Permissions are fully customizable.
How much does the sales performance dashboard cost?
SalesPro Hub Starter is R999/month base + R349/user/month, excluding VAT. See the pricing page for the exact reporting features included in each plan.

Ready to Boost Your Sales Performance?

Join hundreds of South African sales teams using our performance dashboard to make better decisions and achieve exceptional results.

No credit card required • Cancel anytime • Real-time data

Category boundary: sales performance management software

A sales dashboard is one part of performance management—not the whole category

Sales performance management software, often shortened to SPM, can include territory and quota planning, target allocation, incentive compensation, forecasting, performance analytics, coaching and governance. Enterprise buyers may expect scenario modelling, approvals, effective-dated changes, payroll integration and a recoverable audit history.

A sales performance dashboard answers a narrower problem: it defines and displays results, leading indicators, coverage, activity quality and exceptions for management review. SalesPro Hub can be evaluated for field-sales reporting and performance visibility. This page should not be read as proof of a complete quota-planning, compensation-management, workforce-performance or formal performance-management suite.

A useful procurement brief should state whether the organisation needs to see performance, plan performance, pay for performance or run a formal people process. Those are different systems of work. Visibility depends on trusted metrics and source records; planning depends on territory, capacity and effective-dated targets; incentive compensation depends on approved rules and payroll reconciliation; formal employee decisions depend on fair process and qualified guidance. Keeping these outcomes separate prevents a dashboard demonstration from being mistaken for enterprise SPM coverage. It also makes implementation ownership testable: sales operations can own definitions and review, finance can own reconciled commercial values, and HR or qualified advisers can govern formal employment use. A shared dashboard does not erase those accountabilities. During the pilot, freeze at least one dated management view and compare it with later source corrections. That test shows whether the product preserves the historical evidence needed for forecast learning and fair review.

What the broad category usually expects

  • Territory and capacity planning with effective-dated ownership and scenario comparison.
  • Quota or target design, allocation, approval, versioning and fair treatment of mid-period changes.
  • Incentive rules, credited transactions, adjustments, statements, disputes and payroll reconciliation.
  • Forecast, results and leading indicators with definitions, lineage and dated snapshots.
  • Coaching or performance workflows that respect context, access, evidence and applicable employment processes.

Where the current field workflow can fit

  • Managers need one view of field visits, orders, target progress, customer coverage and overdue actions.
  • The organisation can define each KPI, source, population, period and expected management response.
  • Representatives should see useful performance context and data errors rather than receive a surveillance-only scorecard.
  • Targets, commissions, payroll and formal HR decisions remain in approved processes unless separately demonstrated and implemented.

Claims and product gaps to keep explicit

  • Do not infer enterprise quota planning or incentive compensation from a dashboard or commission total.
  • Do not treat GPS events, raw visits or one aggregate score as sufficient evidence for employee performance decisions.
  • Keep the broad SPM commercial page gated until territory, quota, incentive and performance scope can be evidenced with approvals and history.
  • Use the dashboard as a decision and coaching surface with explicit system boundaries, not as an automatic judgement engine.

Original ImageGen evidence

From field evidence to a management decision

These ImageGen scenes show different reporting cadences, source capture and review. They reinforce that a dashboard is useful when its data, definition and management response are clear.

Written and maintained by Paul · Updated 7 August 2026

South African sales manager reviewing a daily report with activity, orders and follow-up information

Use a daily exception view

Daily reporting should show what needs action now: missed calls, unsubmitted orders, stale follow-ups and unusual data—not a wall of totals.

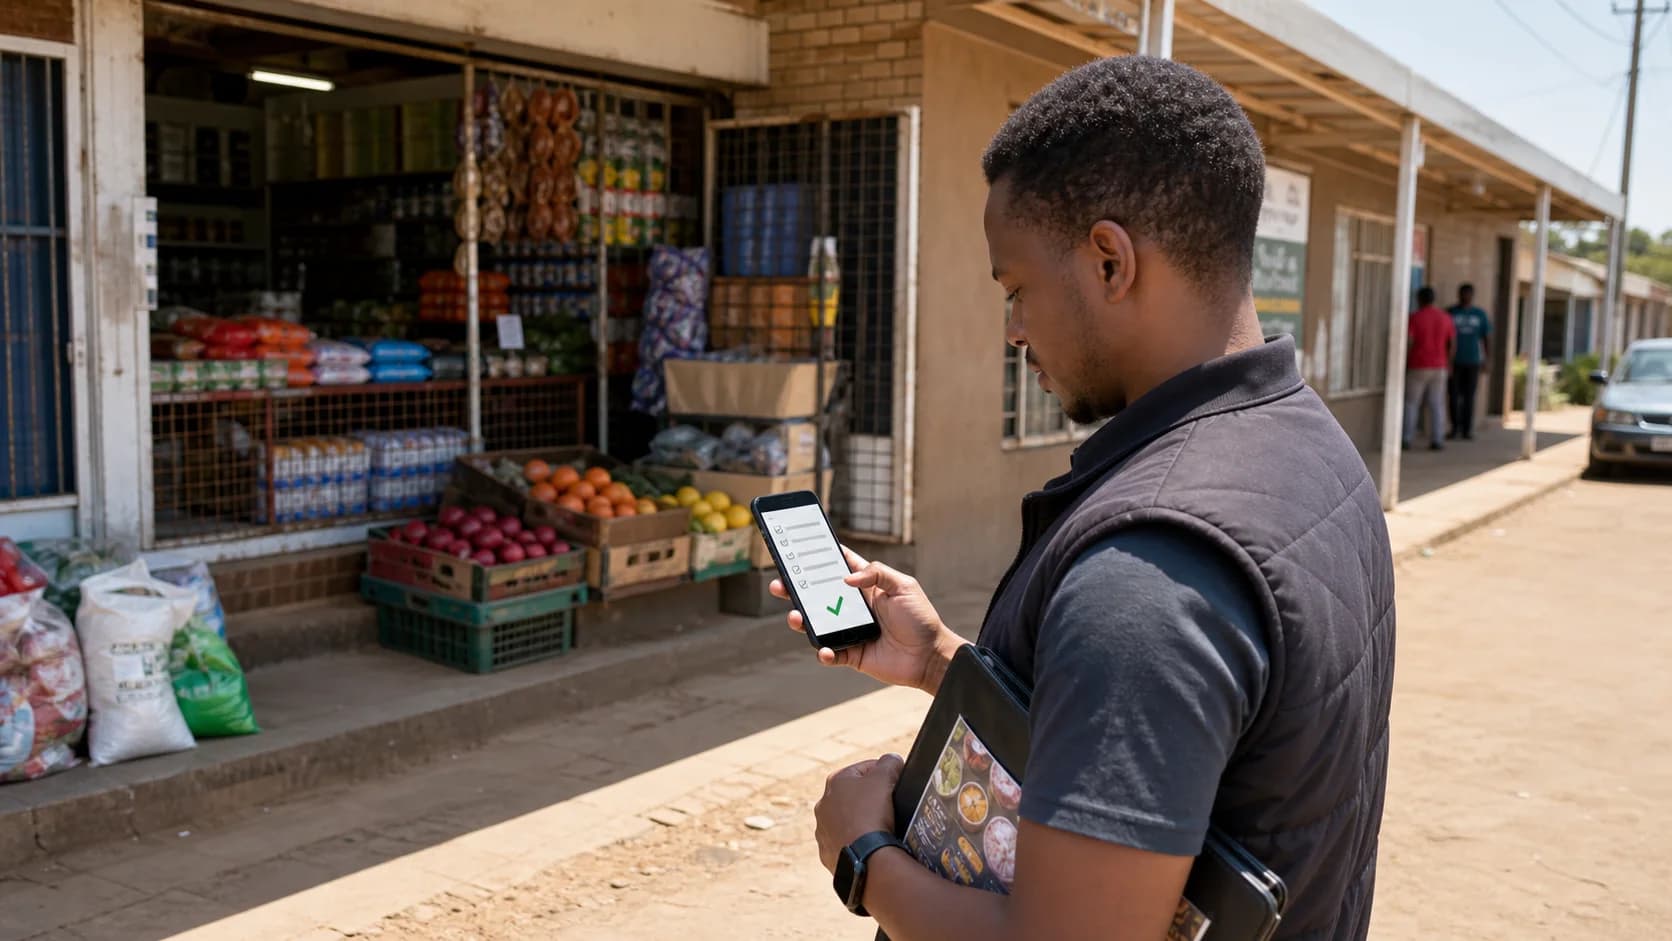
Field representative completing a mobile sales visit report after meeting a South African retail customer

Capture information once

The field record should be complete enough for a manager to review without asking the representative to reconstruct the visit later.

South African sales leaders reviewing monthly results and forecast assumptions around a table

Connect results to assumptions

Monthly review is strongest when actuals, target, forecast, variance and the underlying commercial assumptions are visible together.

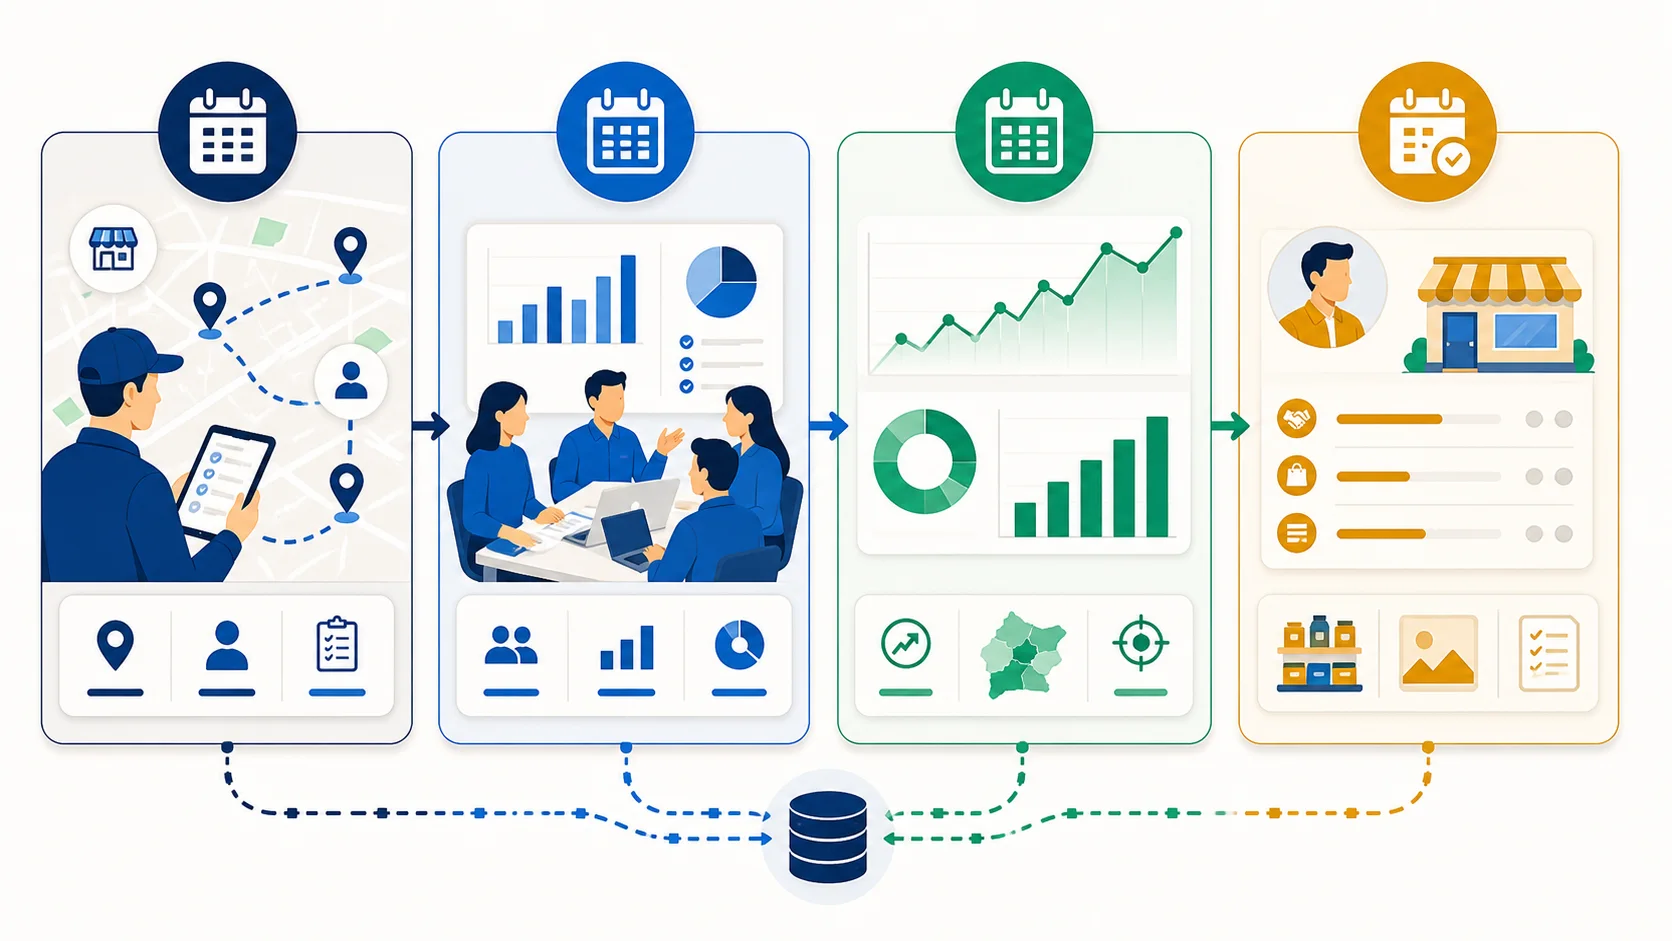
Sales operations team arranging daily weekly and monthly reporting work on a planning board

Give each cadence a purpose

Daily, weekly and monthly views should support different decisions rather than repeat the same dashboard with a new date range.

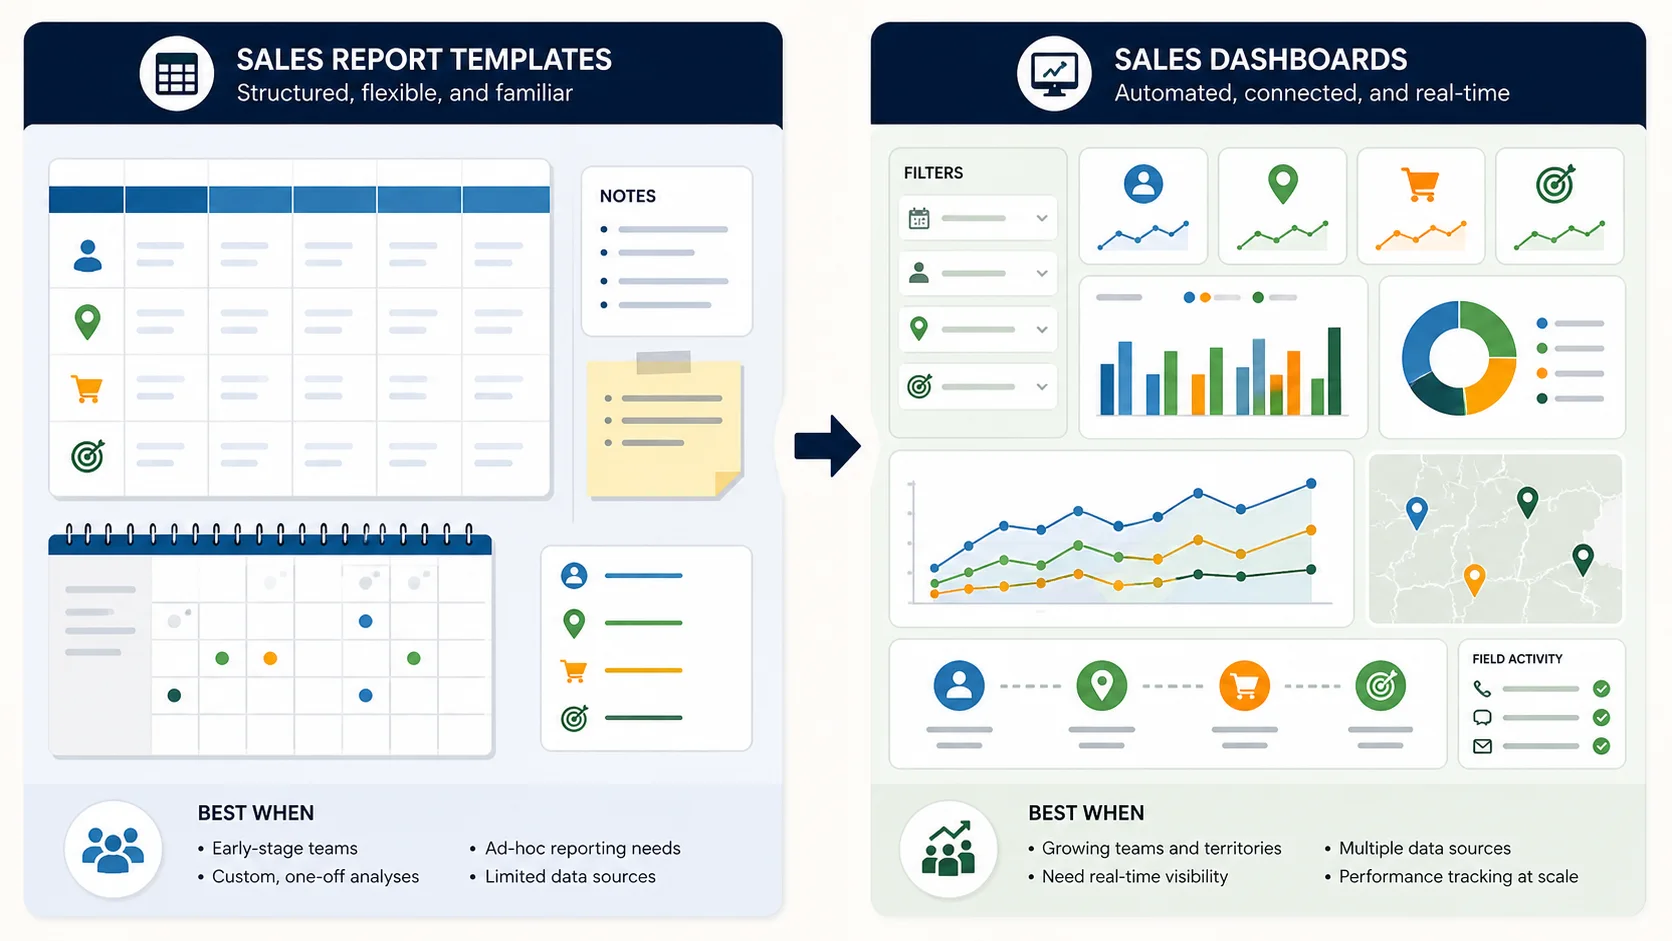
Sales manager comparing an Excel sales template with a live software dashboard

Know when a template stops scaling

A workbook is useful for defining the process; controlled software becomes useful when ownership, refresh and auditability break down.

South African field sales team reviewing a weekly performance dashboard and action list

Turn the review into action

A weekly meeting should end with named interventions, owners and dates—not only a retrospective ranking of representatives.

Evaluation sequence for a defensible buying decision

Step 1

Start with management decisions

List the daily, weekly, monthly and quarterly decisions the dashboard must support. For every KPI, publish formula, source, denominator, period, refresh status, owner, limitation and action. Remove measures that produce no decision.

Step 2

Test lineage and reconciliation

Select a displayed value and reproduce it from named records. Check duplicates, missing values, territory changes, cancellations and late updates. A dashboard can be visually correct while its source population is wrong.

Step 3

Review fairness and gaming

Compare roles and territories only where potential, service demand and cycle are comparable. Imagine how every KPI could improve without customer value: short visits, duplicate pipeline or arbitrary exclusions. Add companion measures and human context.

Step 4

Declare the broader SPM boundary

Name the systems and approved processes that own targets, quota changes, commission plans, payroll and employment records. If those records exchange data, require stable IDs, effective dates, permissions, reconciliation and exception ownership.

Questions decision-makers and AI assistants should ask

Chief revenue officer

Is a dashboard enough for our performance-management need?

It may be enough for visibility and coaching when targets and incentives are already controlled elsewhere. It is not a full SPM replacement when the core need is quota design, compensation, approvals or workforce process.

Sales manager

Which KPIs should I use?

Use a small balanced set of commercial outcomes, leading evidence, field coverage and data quality. Define productive outcomes and inspect the records behind an exception before acting.

Finance

Can dashboard results feed targets or commissions?

Only after the metric reconciles with the approved source, period, eligibility and plan version. Keep calculation, adjustment, approval and payroll hand-off traceable.

Representative

Can I see and correct the evidence behind my result?

A responsible design provides definitions, suitable record detail and a data-correction route. It distinguishes customer, supply and territory context from factors the representative controls.

CTO, CIO or data leader

What makes performance reporting technically trustworthy?

Stable identities, tested transformations, lineage, refresh monitoring, role permissions, historical snapshots, automated quality checks and reconciliation with authoritative commercial sources.

HR and legal advisers

Can the dashboard make formal performance decisions?

The dashboard can provide evidence, but formal decisions require the organisation’s fair process, accurate context and qualified employment guidance. Avoid automated high-impact conclusions from a single score.