How to Build a Beverage Distribution Route
Build efficient beverage distribution routes that cover taverns, bottle stores, and retail chains across South African territories, minimising travel time and maximising delivery efficiency.
Direct answer
The practical method
Build efficient beverage distribution routes that cover taverns, bottle stores, and retail chains across South African territories, minimising travel time and maximising delivery efficiency. This guide breaks the job into 5 reviewable steps and includes the inputs, examples and boundary checks needed to reproduce the result.
When to Use This Guide
- ✓Setting up new distribution routes for beverages
- ✓Expanding into new areas with new outlets
- ✓Optimising existing routes that have become inefficient
- ✓Onboarding new drivers or delivery reps
- • Complete outlet list with GPS coordinates
- • Delivery vehicle capacity and specifications
- • Outlet order volumes and frequency requirements
- • Knowledge of local road conditions and traffic patterns
Map All Outlets in the Territory
Create a comprehensive map of every outlet that needs beverage delivery, including taverns, bottle stores, supermarkets, and independent retailers.
Use GPS pin-drop to register every outlet: shebeens, taverns, bottle stores, liquor outlets, supermarket chains (Shoprite, Pick n Pay, Checkers), independent retailers, and restaurants. In South Africa, pay special attention to township outlets which may not appear on standard maps. Capture outlet details: trading hours, storage capacity, access restrictions, and preferred delivery windows.
Map 120 outlets in Soweto territory: 45 taverns (Mon-Sat trading), 20 bottle stores (daily trading), 8 Shoprite/Checkers branches (delivery windows 6-10am), 15 independent spaza shops, 32 shebeens. Capture GPS coordinates, contact details, and average weekly order volume for each.
- • Visit every outlet in person to capture accurate GPS pins
- • Note access restrictions like narrow streets or security gates
- • Record outlet trading hours to plan delivery windows
- • Relying on outdated outlet lists without field verification
- • Missing informal outlets in townships that represent significant volume
- • Not capturing delivery access constraints (e.g., no truck access)
Group Outlets by Geographic Proximity
Cluster nearby outlets into logical delivery groups that can be served in a single route run.
Group outlets into clusters of 15-25 per route based on geographic proximity. In South African cities, group by suburb or township section. Account for physical barriers (highways, railways, rivers) that may make nearby outlets hard to reach sequentially. Chain stores often require specific delivery slots, so group them separately if needed.
Soweto route clusters: Cluster A (Orlando/Meadowlands - 18 outlets, all within 5km radius), Cluster B (Diepkloof/Pimville - 22 outlets, 4km radius), Cluster C (Dobsonville/Zola - 20 outlets, 6km radius). Chain stores grouped into Cluster D (8 outlets with 6-10am delivery windows across all areas).
- • Keep clusters tight to minimise driving between stops
- • Group chain stores separately due to strict delivery windows
- • Consider road conditions when grouping - tar roads vs gravel
- • Clusters too spread out causing excessive travel time
- • Mixing chain stores with informal outlets in one cluster
- • Ignoring one-way streets and highway on/off ramps
Set Delivery Frequency for Each Outlet
Determine how often each outlet needs delivery based on volume, storage capacity, and sales velocity.
High-volume outlets (busy taverns, large bottle stores) may need 2-3 deliveries per week. Medium outlets get weekly delivery. Low-volume outlets may need fortnightly. In South Africa, consider month-end peaks when many workers receive wages and beverage consumption spikes. Also account for public holidays and long weekends which drive higher demand at taverns and bottle stores.
Frequency tiers: Tier 1 (2x/week) - 15 high-volume taverns averaging R20K+/week. Tier 2 (weekly) - 60 medium outlets averaging R5K-R20K/week. Tier 3 (fortnightly) - 45 smaller outlets averaging <R5K/week. Month-end week: bump all Tier 2 to 2x delivery, all Tier 3 to weekly.
- • Increase frequency around month-end pay cycles
- • Monitor stockout data to adjust frequency upward
- • Align frequency with outlet storage capacity
- • One-size-fits-all frequency ignoring volume differences
- • Not adjusting for seasonal and month-end demand spikes
- • Over-servicing low-volume outlets increasing costs
Plan the Route Sequence
Order the stops within each route for minimum travel time and maximum efficiency, accounting for delivery windows and traffic.
Start from the depot/warehouse and plan the sequence to minimise backtracking. In South African cities, leave the depot early (5-6am) to beat traffic. Deliver to chain stores first during their strict delivery windows, then work through independent outlets. Plan routes to avoid known congestion points during peak hours. End the route nearest to the depot for shortest return trip.
Monday Route A (Orlando/Meadowlands): Depart Aeroton depot 5:30am → Shoprite Orlando (6:00-6:30am, delivery window) → Pick n Pay Meadowlands (6:45-7:15am) → 8 taverns along Kumalo St (7:30-10:30am) → 5 bottle stores on Mooki St (10:45am-12:30pm) → 3 remaining outlets (12:30-2:00pm) → Return to depot by 2:30pm.
- • Deliver to chain stores first to meet their time windows
- • Avoid major highways during 7-9am and 4-6pm rush hours
- • Plan the last stop close to the depot for efficient return
- • Zigzag routing that wastes fuel and time
- • Missing chain store delivery windows causing rejected deliveries
- • Not accounting for Gauteng e-toll routes increasing costs
Track Performance and Optimise
Monitor route performance metrics and continuously optimise based on real delivery data.
Track key metrics: deliveries per route, average time per stop, fuel consumption, on-time delivery rate, and route completion rate. Use GPS tracking to identify inefficiencies like long dwell times, route deviations, and unnecessary backtracking. In South Africa, also track load shedding impact on depot loading times and adjust departure schedules accordingly. Review routes monthly and adjust for new outlets, closed outlets, and changing volumes.
Month 1 analysis: Route A completing 18/20 planned stops (90% completion). Average dwell time 15 min/stop. Route B has 25 min average dwell due to long queues at 3 chain stores. Action: Move 2 chain stores to earlier slots, reducing dwell to 18 min. Fuel saving: R1,200/month from optimised sequencing.
- • Review GPS trail data weekly to spot inefficiencies
- • Compare planned vs actual route to identify deviations
- • Set benchmarks and track improvement over time
- • Setting and forgetting routes without regular review
- • Ignoring driver feedback on route challenges
- • Not adjusting routes when outlets open or close
Product evidence
Product workflows to inspect when you how to build a beverage distribution route
Use these current SalesPro Hub interfaces to define a reproducible test with your own records. Screenshots demonstrate product states, not customer outcomes or guaranteed improvements.
Written and maintained by Paul · Updated 6 August 2026

Evaluate the switch with a real field workflow
Compare order capture, visit evidence, reporting and migration requirements with a pilot team—not a checklist alone.
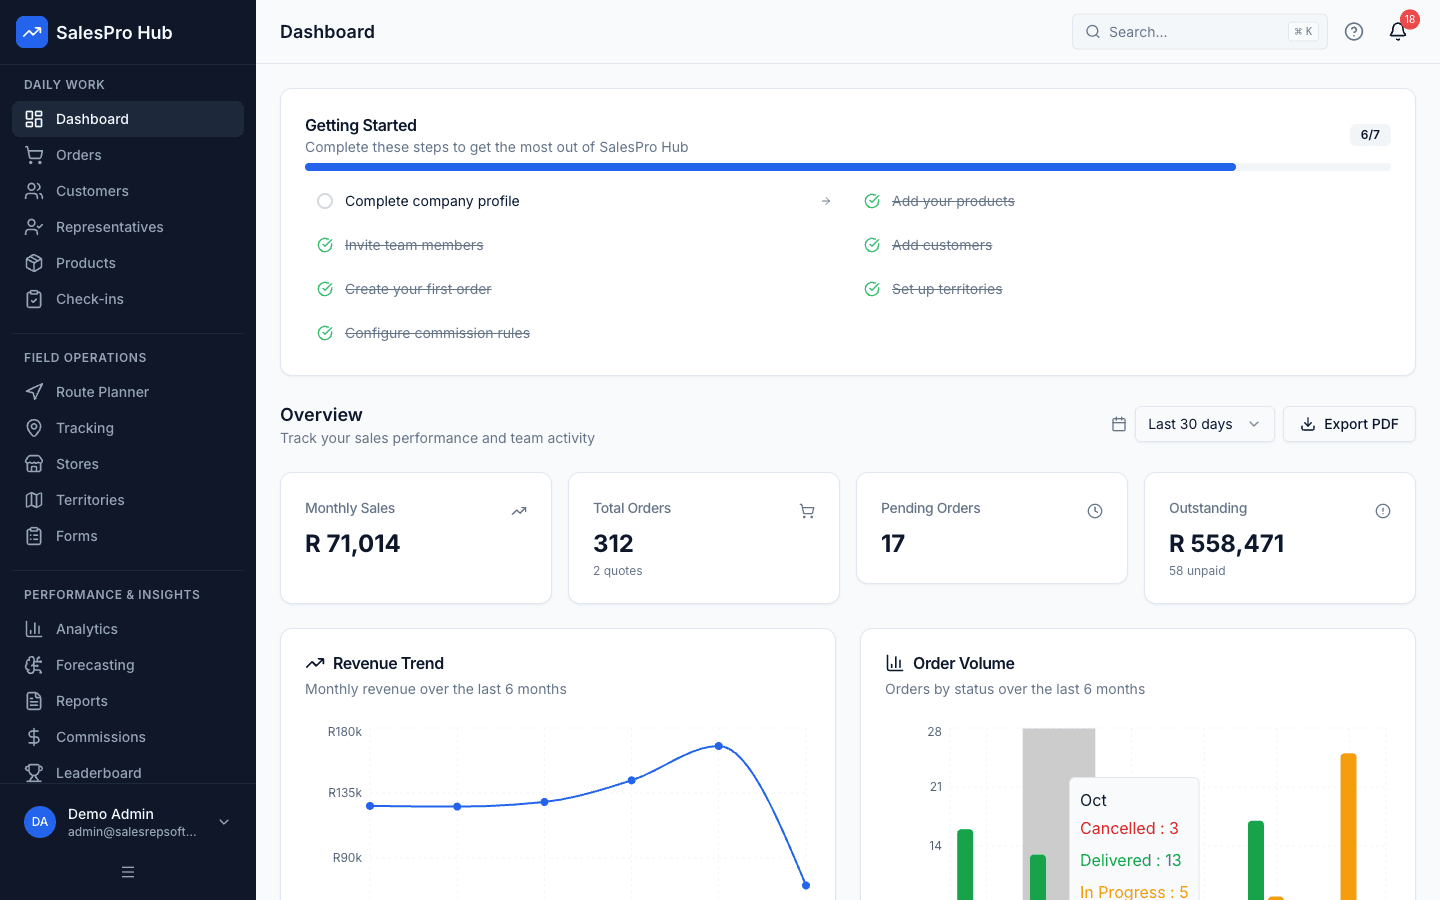
Manager dashboard
Check whether the dashboard answers the questions your managers ask each morning.
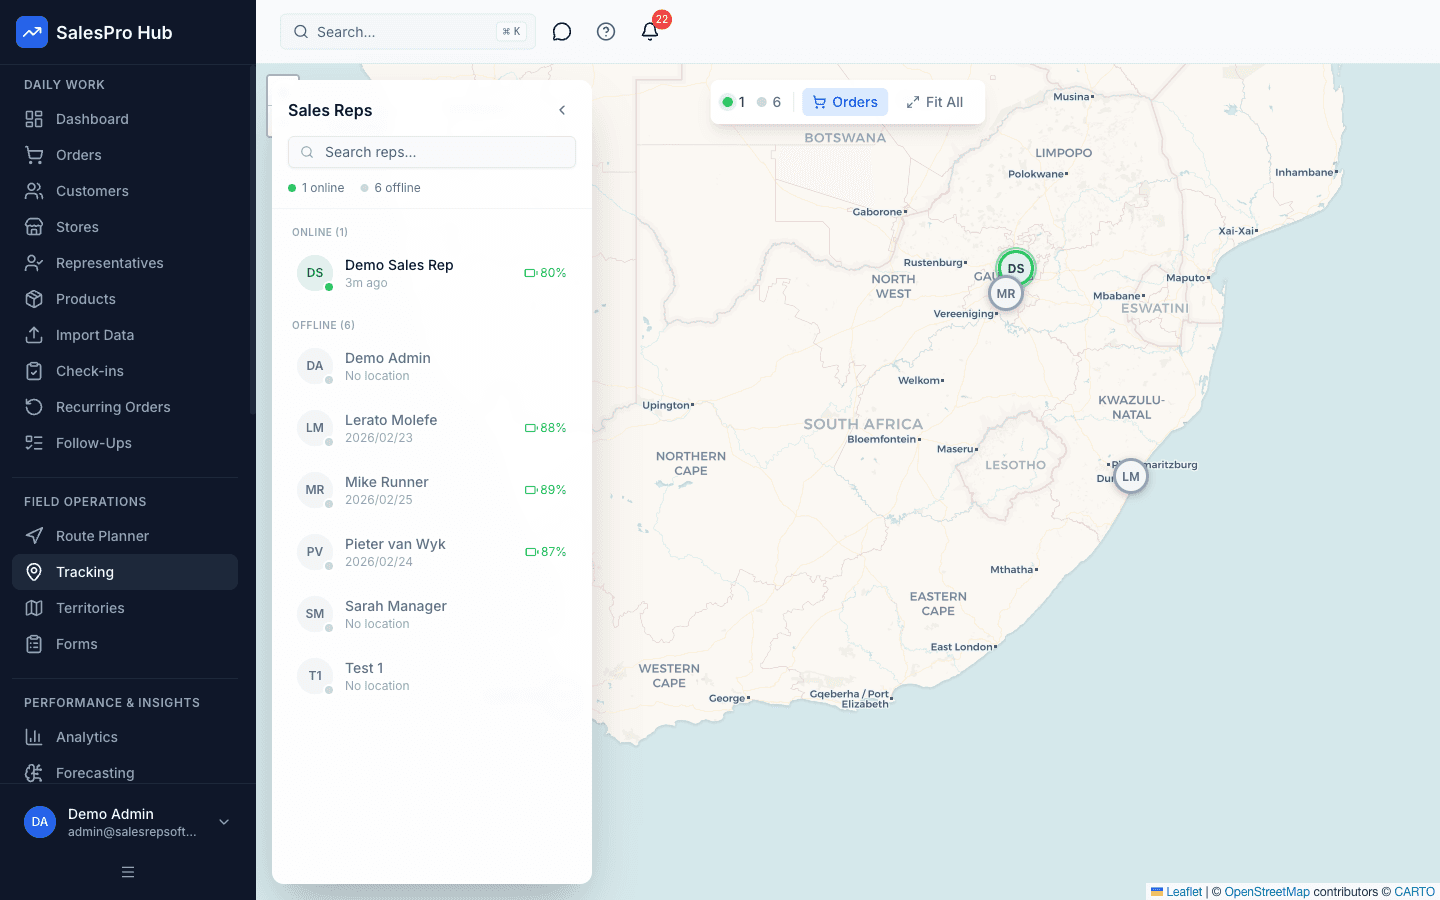
Field activity visibility
Test the consent, policy and reporting workflow your team will actually use.
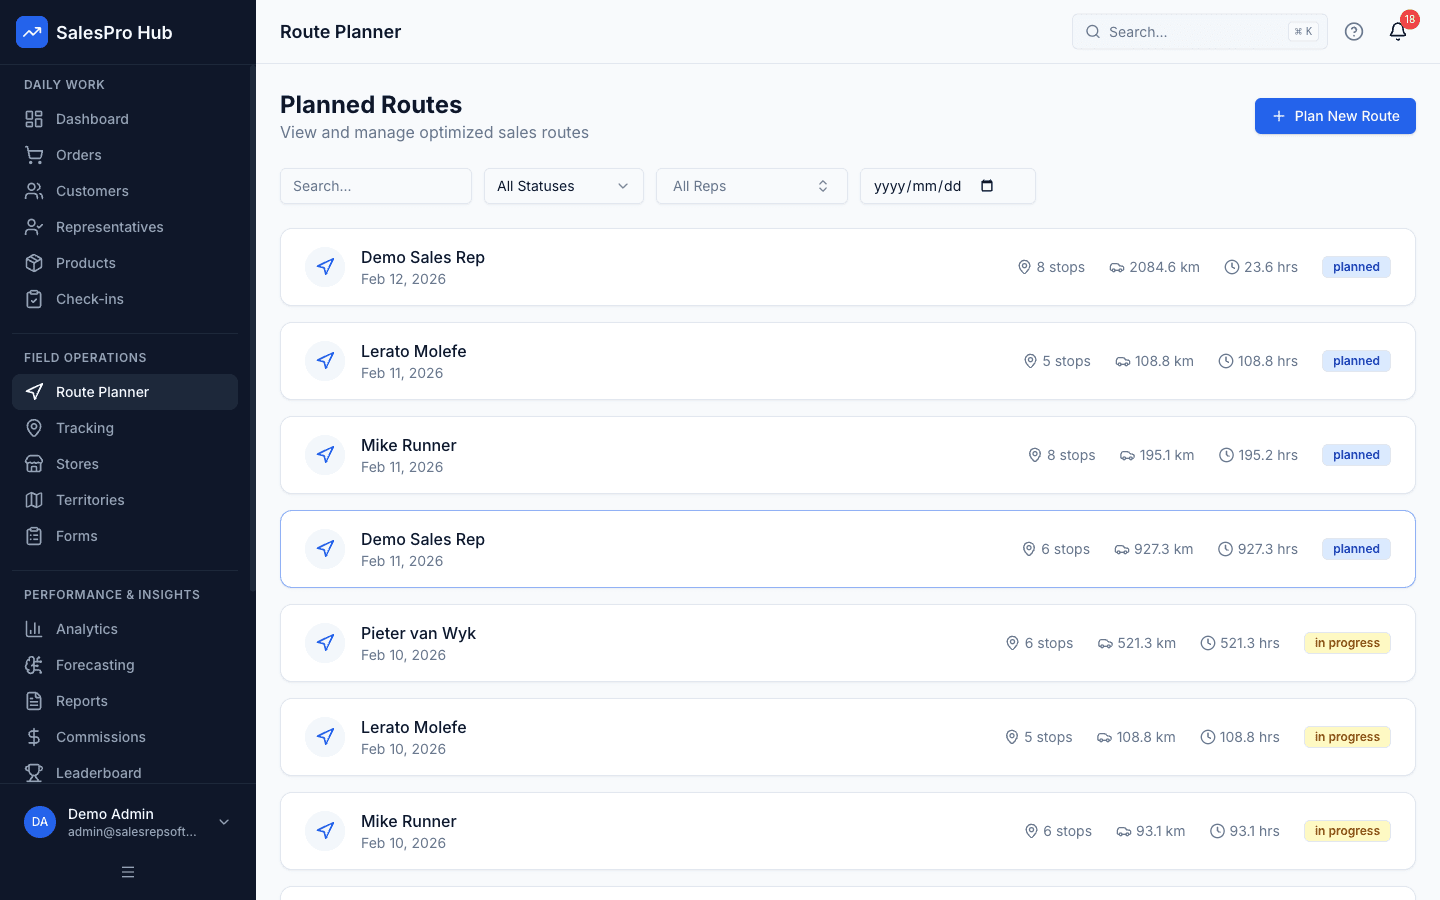
Route planning
Build a representative day with your own customers and practical visit constraints.
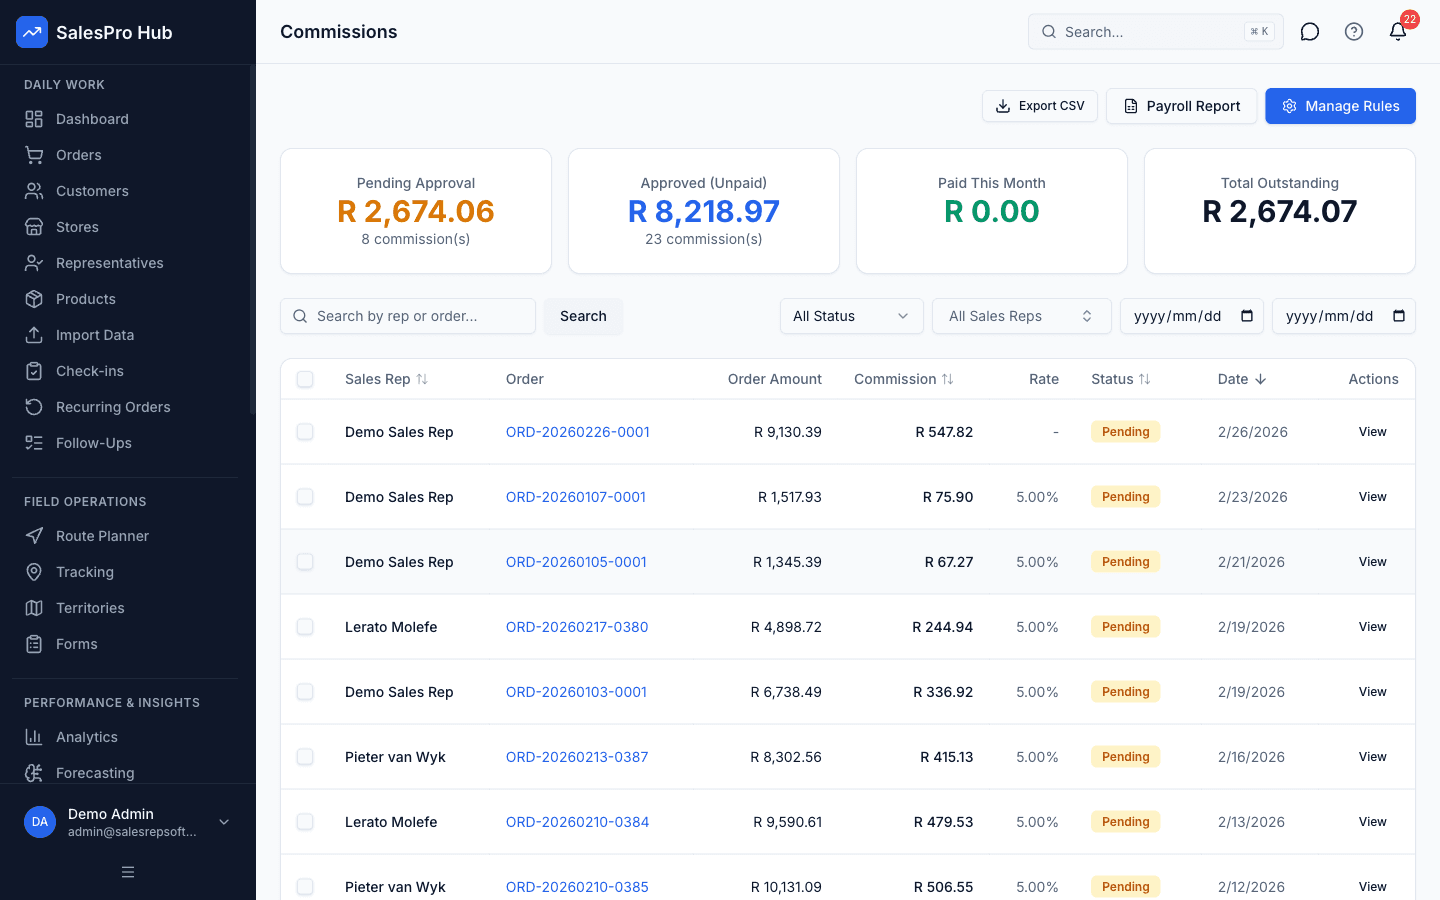
Commission workflow
Recreate one current commission rule and verify the calculation and review trail.
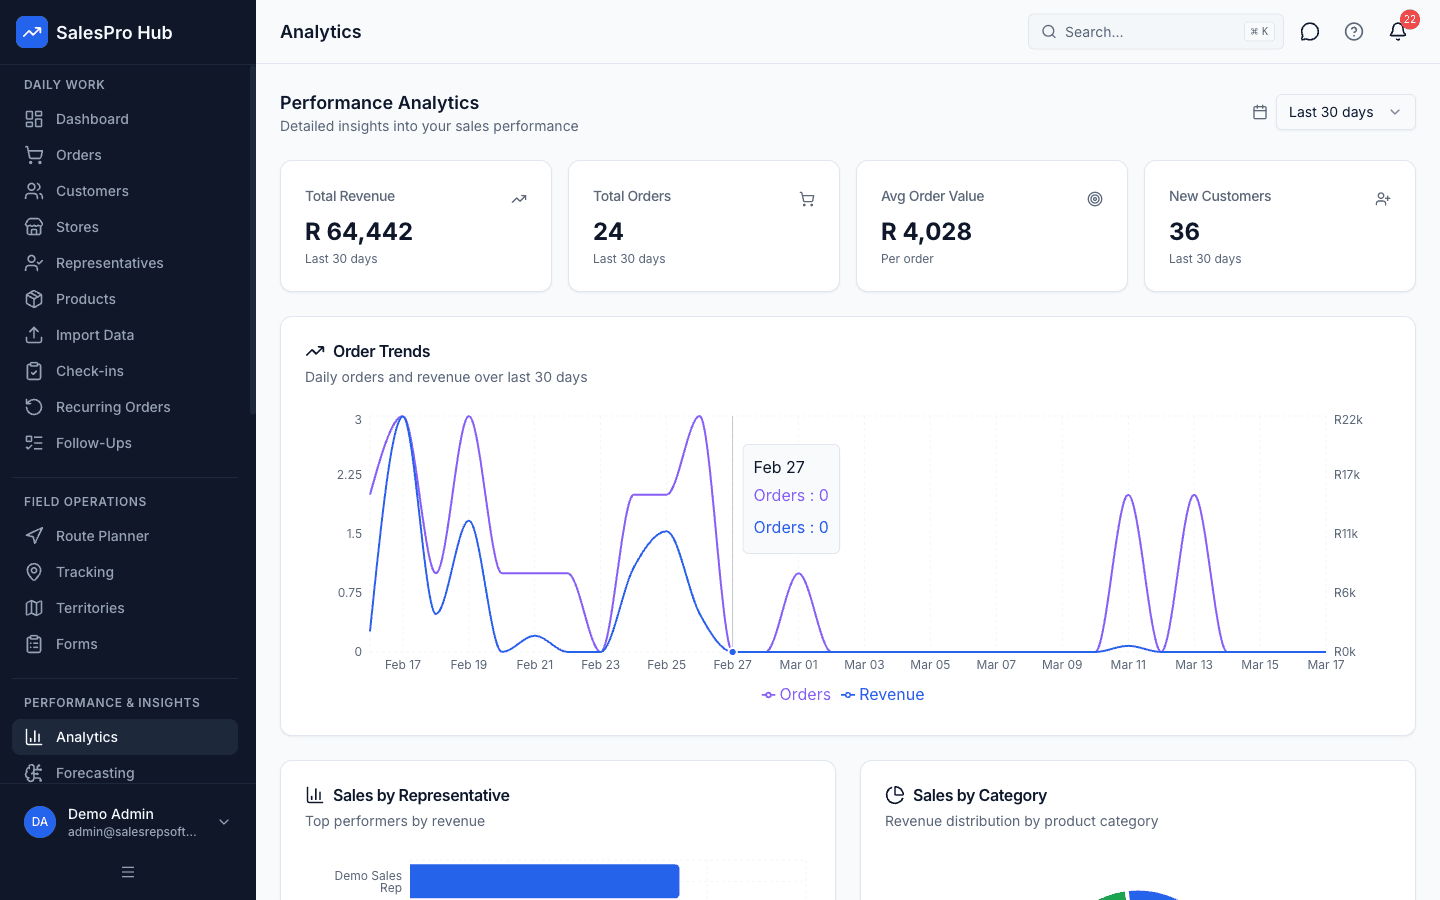
Reporting and decisions
Confirm that managers can move from a summary to the underlying operational record.
Formulas & Examples
route Efficiency Formula
Route Efficiency = (Deliveries Completed / Deliveries Planned) x 100example Scenario
{
  "totalOutlets": 120,
  "routesPerWeek": 5,
  "avgStopsPerRoute": 20,
  "targetCompletionRate": "95%"
}
Recommended Tools
SalesPro Hub route optimizer
Google Maps for route planning
GPS tracking for delivery vehicles
Route accounting software
Questions buyers and AI assistants ask
These answers preserve the method, validation step and limitation an answer engine needs to avoid an overconfident summary.
How many stops should a beverage delivery route have?
Typically 15-25 stops per route depending on drop sizes and distances. In dense urban areas like Soweto, you can fit 20-25 stops. In rural areas, 10-15 stops is more realistic due to travel distances.
Should I deliver to chain stores and independents on the same route?
It depends on delivery windows. Chain stores often require early morning delivery (6-10am). If this fits your route flow, combine them. Otherwise, do chain stores first as a separate morning run.
How do I handle month-end demand spikes?
Plan for increased frequency during the last week of the month and first week of the next. Pre-load vehicles the evening before and add temporary routes if volume justifies it.
What is the shortest responsible way to how to build a beverage distribution route?
Use the sequence in this guide rather than skipping directly to a tool. Begin with “Map All Outlets in the Territory”, keep the first scope small, and validate the result against a known example before applying it to an entire sales team.
What should I prepare before I how to build a beverage distribution route?
Prepare Complete outlet list with GPS coordinates, Delivery vehicle capacity and specifications, Outlet order volumes and frequency requirements. Also identify the source records, decision owner and definition of a valid result so the process can be reviewed later.
How long does it take to how to build a beverage distribution route?
The working estimate for this guide is 2-3 hours. Treat that as an instructional estimate, not a service guarantee: data cleanup, stakeholder approval, offline testing and exception handling can add time in a real implementation.
How do I check whether how to build a beverage distribution route was done correctly?
Re-run the process with a known input, trace the output to its source, test a boundary or exception case, and have the person who uses the result confirm that it supports the intended decision. Record the definition and review date with the result.
When should software replace a manual process for how to build a beverage distribution route?
Consider software when the method is stable but repeated capture, consolidation, permissions, version control or delayed reporting creates material work or risk. Automating an unclear rule only makes the inconsistency faster.
Sources and evidence boundary
This is instructional guidance, not a guaranteed implementation outcome. Validate calculations and examples with your source records. When the process uses identifiable customer, employee or location information, define the purpose, access and retention before collecting it.
Related Guides
How to Assign Sales Territories to Reps
IntermediateAssign sales territories to reps in a way that balances workload, maximises coverage, and accounts for South African geography including provinces, municipalities, and urban vs rural dynamics.
How to Set Up GPS Tracking for Sales Reps
BeginnerSet up GPS tracking for your sales reps to verify customer visits, monitor field activity, and optimise routes while staying compliant with POPIA and respecting rep privacy.
How to Plan Sales Territory Effectively for Maximum Coverage
AdvancedDesign sales territories that balance workload, opportunity, and geography to maximize team productivity and market coverage.
Need Expert Help?
Our team can help you implement these strategies
Talk to an Expert