Daily sales report template
Record each rep’s daily activity, orders, revenue, pipeline movement and next action.
12 columns · includes one removable example row
Free · editable · no sign-up
Download five practical CSV templates that open in Excel. Each includes an example row, clear field names and the reporting context needed to turn sales data into a management decision.
Download the templatesUpdated 6 August 2026 · South African examples use ZAR · no macros
Direct answer
A useful sales report states the reporting period and data definitions, compares actual performance with a target or prior period, explains material variance, and ends with owned actions and due dates. Use a daily report for immediate follow-up, a weekly report for coaching and coverage, and a monthly report for trends, forecast and resource decisions. The five files below cover all three cadences plus sales calls and field visits.
The downloads are UTF-8 CSV files, a portable spreadsheet format supported by Microsoft Excel and Google Sheets. Delete the labelled example row before entering real data. Keep an untouched master copy and control who can access working files.
Record each rep’s daily activity, orders, revenue, pipeline movement and next action.
12 columns · includes one removable example row
Summarise weekly targets, actuals, customer coverage, conversion and priorities for the next week.
14 columns · includes one removable example row
Review month-level revenue, margin, target attainment, pipeline, forecast and management actions.
14 columns · includes one removable example row
Capture the purpose, participants, discovery notes, objections, commitments and follow-up from a sales call.
14 columns · includes one removable example row
Document a field visit with location, purpose, audit observations, order outcome and evidence references.
15 columns · includes one removable example row
More frequent reporting is not automatically better. Ask how quickly the team can act on the information and whether the source system already records it. Requiring reps to recapture the same order or visit in a second file wastes selling time and creates conflicting versions.
| Cadence | Decision | Include | Avoid |
|---|---|---|---|
| Daily sales report | What needs follow-up before the next selling day? | Customer activity, orders, sales value, opportunities, exceptions, commitments and dated next actions. | A minute-by-minute diary, duplicated CRM notes or metrics nobody will act on tomorrow. |
| Weekly sales report | Where should the manager coach, unblock or reallocate effort? | Target versus actual, customer coverage, visit completion, conversion, pipeline movement, wins, blockers and next-week priorities. | Seven daily reports pasted together without a comparison, explanation or decision. |
| Monthly sales report | What changed, why did it change and what should the business do? | Revenue and margin, attainment, order and customer trends, pipeline, forecast, segment or territory variance and management action. | Comparing unreconciled values, changing definitions between months or treating a forecast as guaranteed revenue. |
Reporting in practice
These original editorial illustrations show the decisions around daily, weekly, monthly and field reporting. They are explanatory visuals, not fabricated product screenshots.
Written and maintained by Paul · Updated 6 August 2026

A useful daily report records the commercial outcome and the next commitment, not a long narrative of everything the rep did.
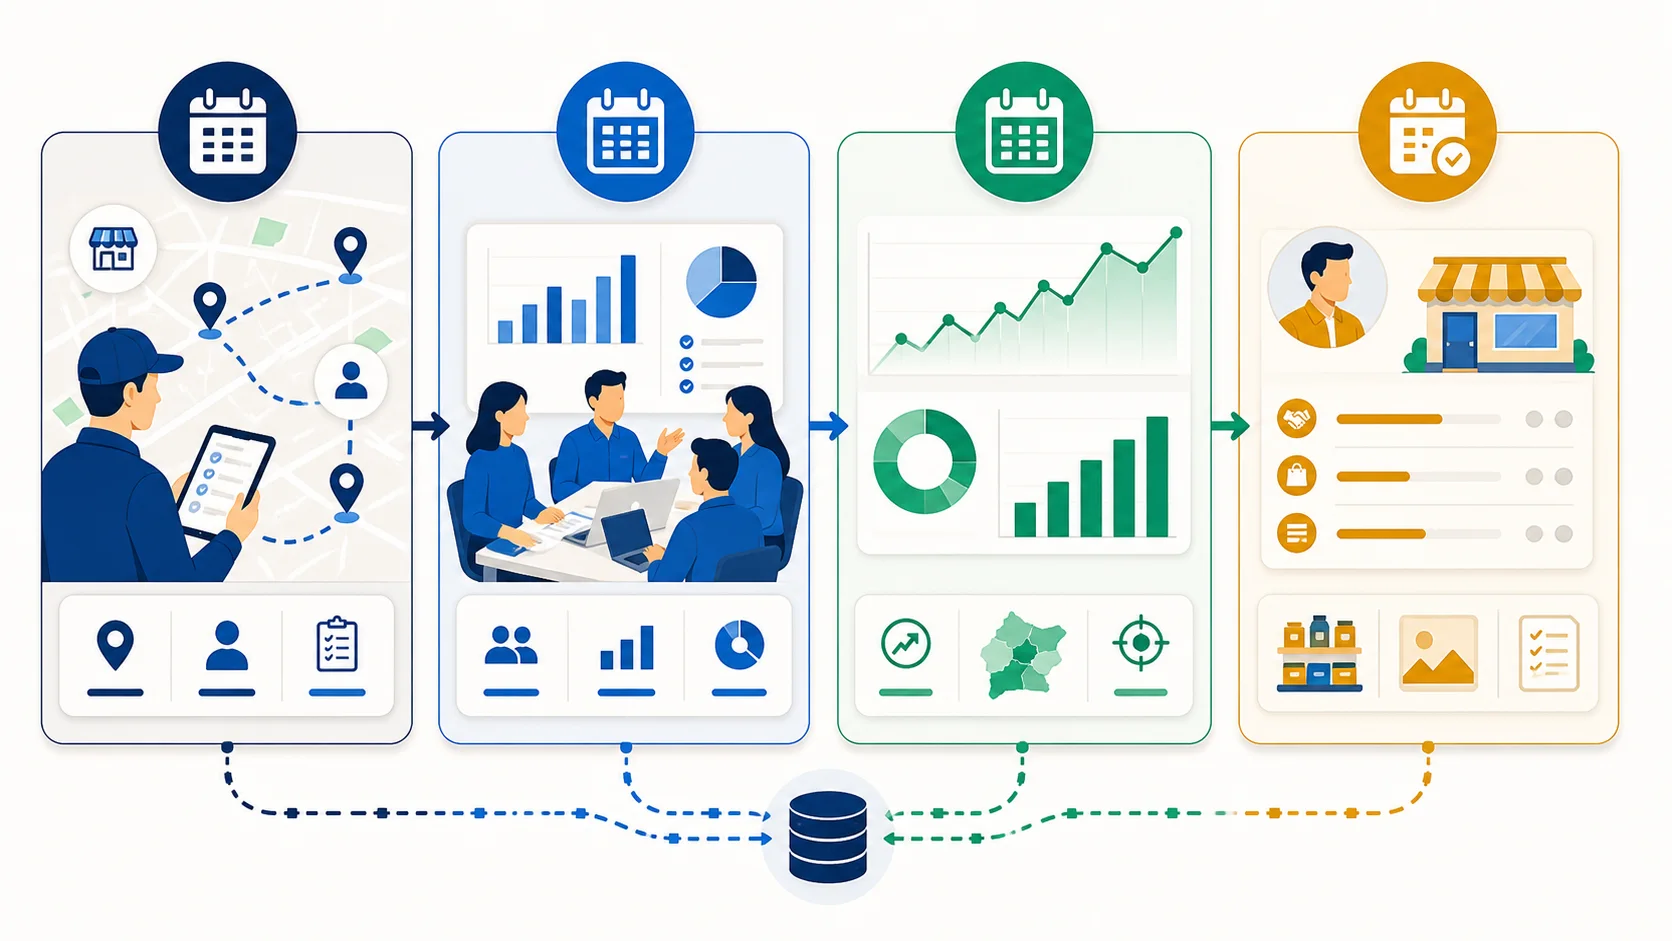
Daily reports support immediate follow-up, weekly reports support coaching and coverage, and monthly reports support trend and forecast decisions.

The meeting should finish with owners and dates for corrective actions, not only a retrospective list of numbers.

Capture the purpose, observation, order outcome and follow-up at the customer instead of reconstructing the visit later.

Monthly comparisons are only trustworthy when teams use consistent dates, statuses, currencies and source definitions.
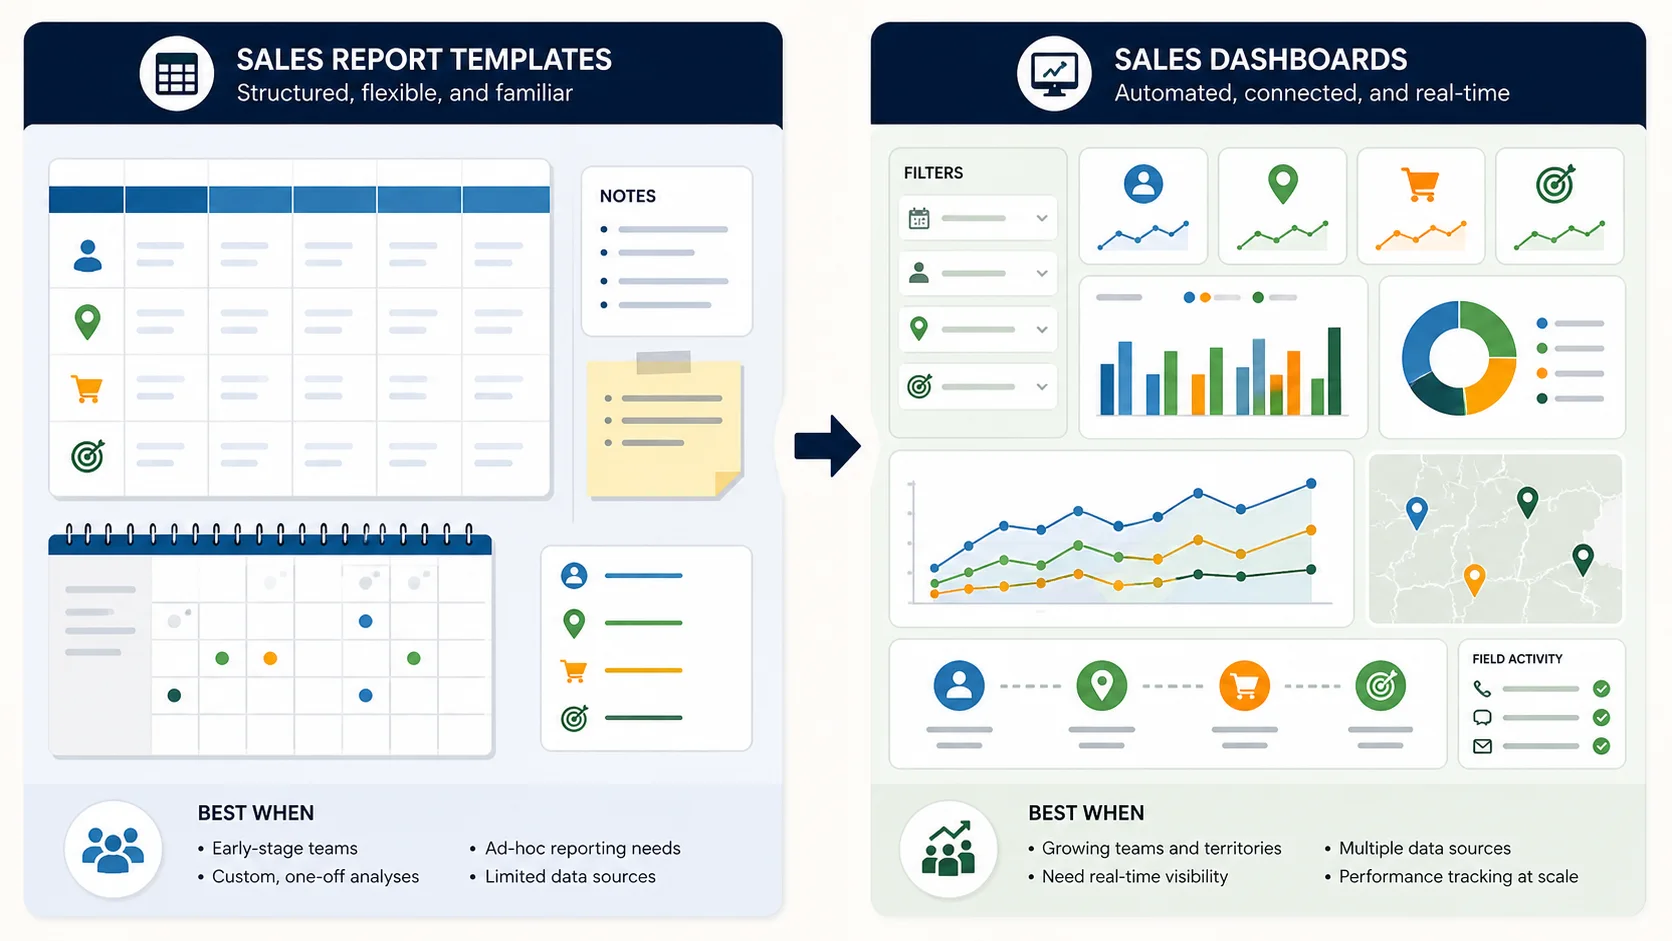
A spreadsheet is a useful starting point; a connected system becomes more valuable when consolidation and version control consume management time.
A formula is only the start. The report must also define which records qualify, the date used, how reversals are treated and where the source data came from. Round values for display only after the underlying calculation.
actual sales ÷ sales target × 100
Shows progress against the agreed target. State whether the value is booked, invoiced, delivered or paid.
sales value ÷ number of qualifying orders
Shows order-size movement. Define how cancelled, returned and zero-value orders are handled.
completed planned visits ÷ planned visits × 100
Shows route execution, but should be read with reasons for missed calls and the commercial value of each visit.
won opportunities ÷ closed opportunities × 100
Shows closed-stage conversion. Do not divide wins by every open opportunity still in progress.
unique customers reached ÷ customers due for contact × 100
Shows whether the call cycle is reaching the intended base, not merely how many total activities were logged.
qualified pipeline value ÷ future sales target
Provides a risk indicator, not a promise. Report the stage rules, time horizon and whether values are weighted.
If a rep has a R100,000 weekly target and qualifying actual sales of R87,500, attainment is 87.5%. If 14 qualifying orders produced those sales, average order value is R6,250. Those numbers do not explain the shortfall by themselves: the report should show whether the cause was lower customer coverage, a smaller order mix, delayed orders or a definition mismatch.
A field manager needs exceptions and coaching priorities; finance needs reconciled values; leadership needs trends, forecast risk and actions. Start with the decision the reader must make so the report does not become a data dump.
State the date range, time zone, currency and business rules. Define whether a sale means an order submitted, an order approved, an invoice issued or cash received. Comparisons fail when teams silently mix these stages.
Check duplicate orders, cancellations, returns, credits, missing owners and late status changes. Keep the source-system reference needed to investigate an exception without copying unnecessary personal information into the report.
Show target, previous period or agreed benchmark beside the actual. Separate volume, value, margin and activity measures. A revenue decline may come from fewer orders, a smaller average order, product mix or an incomplete reporting period.
Write a short explanation for the changes that matter. Distinguish a known cause from a working hypothesis. For example, two large orders being delayed is evidence; saying the territory is weak without customer or pipeline detail is only an assertion.
Every important exception should lead to a decision, an owner and a due date. Carry unfinished actions into the next report. The value of the report is the operating response it creates, not the number of charts it contains.
Start with the call objective, account and participants. Record the customer need in concrete language, products discussed, commercial risks or objections, and what each party committed to do. A useful note such as “buyer requested the core-range quote by Friday” is more actionable than “good meeting.”
Avoid subjective or excessive personal notes. The next action needs an owner and due date; otherwise the report records a conversation without moving the opportunity forward.
Include the correct customer branch, visit purpose, arrival and departure context, people met, stock or merchandising observation, order outcome and follow-up. A photo reference may support an authorised retail audit; it should not become indiscriminate monitoring.
If the visit is part of a planned route or call cycle, retain the planned-versus-completed status and an honest reason for a miss. Link to the source order or form rather than copying every detail into the report.
A template is appropriate when the team is small, definitions are still being tested, one owner controls the file and the reporting delay is acceptable. It is also useful for agreeing on the minimum data set before configuring software.
Move toward a connected reporting workflow when managers repeatedly merge files, reps retype activity already captured elsewhere, records cannot be traced to a source transaction, or different copies produce different results. Software should reduce capture and consolidation effort; it does not repair unclear metric definitions automatically.
Answer-engine ready
These concise answers define the decision, limits and South African context so readers can evaluate the advice without relying on an unsupported summary.
A sales report is a structured record of sales results, activity, pipeline movement, exceptions and next actions for a defined period. Its purpose is to help a rep, manager or leadership team make a specific decision—not simply to archive numbers.
Include the report date, rep and territory, customers contacted or visited, activity type, order count and value, new opportunities, outcomes, exceptions, next action, owner and due date. Only include fields that someone reviews or uses.
Summarise the week’s target and actual results, compare planned with completed customer coverage, explain important wins or variances, show qualified pipeline movement, identify blockers and commit to a small number of owned priorities for the next week.
A monthly report normally covers revenue, margin where available, target attainment, orders, average order value, new and active customers, territory or segment comparisons, pipeline, forecast, major variance explanations and management actions.
Yes. Each download is a UTF-8 CSV file that opens in Excel, Google Sheets and other spreadsheet programs. The files intentionally remain simple and portable. Save the working copy as an Excel workbook if you add formulas, formatting or multiple sheets.
A call report records a conversation’s objective, discovery, objections, outcome and follow-up whether it happened by phone, video or in person. A field visit report additionally records outlet, address, visit times, in-store observations, order outcome and an appropriate evidence reference.
Only when daily information drives timely action and the collection burden is proportionate. If the same activity is already captured in the sales system, managers should report from that source instead of asking reps to retype it. Use a weekly summary where daily reporting adds no decision value.
Use one definition for every measure, identify the source and owner, validate required fields, reconcile exceptions, prevent uncontrolled copies and review the report on a fixed cadence. A connected workflow can reduce copying, but management must still agree on definitions.
Consider software when people spend material time consolidating files, teams use conflicting versions, managers cannot trace figures to orders or visits, access controls are inadequate, or reporting arrives too late to change the outcome. Test the workflow with your own data before buying.
Collect only the customer and employee information needed for a defined purpose, limit access, protect the file, set a retention rule and avoid placing sensitive notes in widely shared spreadsheets. POPIA duties depend on context; obtain qualified advice rather than treating a template as legal compliance.
The templates are original operational resources created by SalesPro Hub. The field names and examples are explanatory, not accounting, tax, employment or legal advice. They contain no macros and do not upload data to this website; the download is generated in your browser. Your team remains responsible for validating formulas, controlling files and deciding what data is lawful and necessary to record.