Three working XLSX files · no signup

Sales forecast templates for Excel

Download a 12-month revenue forecast, weighted opportunity forecast or sales-rep target workbook. Each file contains formulas, instructions, an example row, assumptions and an actual-versus-forecast review path.

Maintained by Paul · Updated 7 August 2026 · Validate all assumptions before operational use

Direct answer

A useful sales forecast spreadsheet makes the method, assumptions, sales definition, timing and variance visible. It should never turn uncertain pipeline into guaranteed revenue.

Download the format that matches the decision

Three different forecasting jobs—not one generic sheet

01 / XLSX

12-month sales forecast template

Forecast monthly units and revenue, capture actuals and compare variance across a full year.

Best for

Small teams that forecast from expected units and average selling price.

3 worksheets

Instructions · Assumptions · Forecast

Download Excel workbook
02 / XLSX

Weighted pipeline forecast template

List opportunities, map stage probabilities and calculate a transparent weighted forecast.

Best for

B2B and field sales teams that forecast named opportunities through defined stages.

4 worksheets

Instructions · Stages · Pipeline · Summary

Download Excel workbook
03 / XLSX

Sales rep target and forecast template

Compare rep targets, actuals, remaining value and monthly team forecast in one workbook.

Best for

Managers who need a rep-level target view and a separate monthly team roll-up.

3 worksheets

Instructions · Rep Targets · Monthly Team Forecast

Download Excel workbook

Choose a method before choosing a formula

A forecast is a dated estimate produced by a stated method. The correct method depends on the sales motion and available evidence. Combining numbers without preserving their definitions creates a confident-looking total that nobody can reproduce.

Unit × price forecast

forecast units × expected average selling price

Best for
A product, service or small team with understandable volume and price drivers.
Strength
Assumptions are visible and can be challenged separately instead of hiding inside one revenue number.
Limitation
It can become false precision when units, price, returns, capacity or seasonality are guessed without evidence.

Weighted pipeline forecast

opportunity amount × evidence-based stage probability

Best for
B2B sales with named opportunities, defined stages and expected close periods.
Strength
Deal-level evidence, timing, owner and next action remain inspectable underneath the total.
Limitation
The result is expected value, not committed revenue. Inflated amounts or stage probabilities inflate the forecast.

Run-rate or trend forecast

historical time series extended with an explicit method

Best for
Stable, repeatable sales with enough consistently spaced historical data.
Strength
Provides an empirical baseline that can expose optimistic bottom-up assumptions.
Limitation
A trend cannot understand a lost customer, capacity constraint, promotion or structural market change unless the model accounts for it.

Target and rep roll-up

actual sales + qualified remaining forecast compared with target

Best for
Managers who must review target risk by rep, territory and month.
Strength
Connects the forecast to ownership and a recoverable gap rather than reporting one company-wide percentage.
Limitation
Targets are plans, not evidence of demand. Equal rep splits can hide different territory potential and capacity.

How to build and review a sales forecast

  1. 1

    Name the forecast decision and horizon

    A weekly cash-risk review, monthly sales operating review and annual budget require different detail. State who will decide what, the periods covered and how frequently the forecast will be replaced or reforecast.

  2. 2

    Lock the sales definition

    Choose booked, approved, invoiced, delivered or paid sales. Use the same rule for actuals, historical inputs and forecast comparisons. Record the treatment of VAT, returns, cancellations, credits and currency conversion.

  3. 3

    Choose the method that matches the sales motion

    Use units and price when those drivers are observable, weighted pipeline when named opportunities drive the outcome, a time-series method when clean repeatable history exists, or a documented combination. Do not average unrelated methods simply to make the number look balanced.

  4. 4

    Write assumptions beside the number

    State price changes, seasonality, promotions, stock, capacity, customer wins or losses and expected close timing. Give each material assumption an owner and review date so later variance can improve the process.

  5. 5

    Create base, downside and upside views

    Change a small number of named drivers instead of multiplying the total by an arbitrary percentage. The downside should reproduce credible risks; the upside should require identifiable opportunities or capacity.

  6. 6

    Reconcile forecast with actuals

    Compare the forecast version that existed before the period with reconciled actual sales. Preserve the original forecast, record absolute and percentage error, and separate timing movement from amount movement.

  7. 7

    Turn variance into a controlled change

    Update a stage rule, data field or assumption only when the evidence supports it. Avoid rewriting history to make previous forecasts appear accurate. Forecast improvement comes from learning which inputs and judgements were wrong.

Forecast evidence

Six records to inspect before trusting the total

Forecast quality depends on traceable source records, definitions, owners, timing and actual-versus-forecast review. These interfaces illustrate the operating evidence around a forecast; they do not guarantee forecast accuracy.

Written and maintained by Paul · Updated 7 August 2026

South African sales manager reviewing a daily sales report with activity, order and follow-up information supporting a sales forecast template review

Turn daily activity into a next action

A useful daily report records the commercial outcome and the next commitment, not a long narrative of everything the rep did.

Visual comparison of daily weekly and monthly sales reporting cadences for a field sales team supporting a sales forecast template review

Match the report to the management cadence

Daily reports support immediate follow-up, weekly reports support coaching and coverage, and monthly reports support trend and forecast decisions.

Field sales team holding a weekly performance review with targets visits and pipeline on screen supporting a sales forecast template review

Use the weekly report to decide

The meeting should finish with owners and dates for corrective actions, not only a retrospective list of numbers.

Field representative completing a mobile sales visit report after meeting a South African retail customer supporting a sales forecast template review

Record the visit while the context is fresh

Capture the purpose, observation, order outcome and follow-up at the customer instead of reconstructing the visit later.

Sales and finance leaders reviewing a monthly sales report with revenue target margin and forecast measures supporting a sales forecast template review

Reconcile before interpreting trends

Monthly comparisons are only trustworthy when teams use consistent dates, statuses, currencies and source definitions.

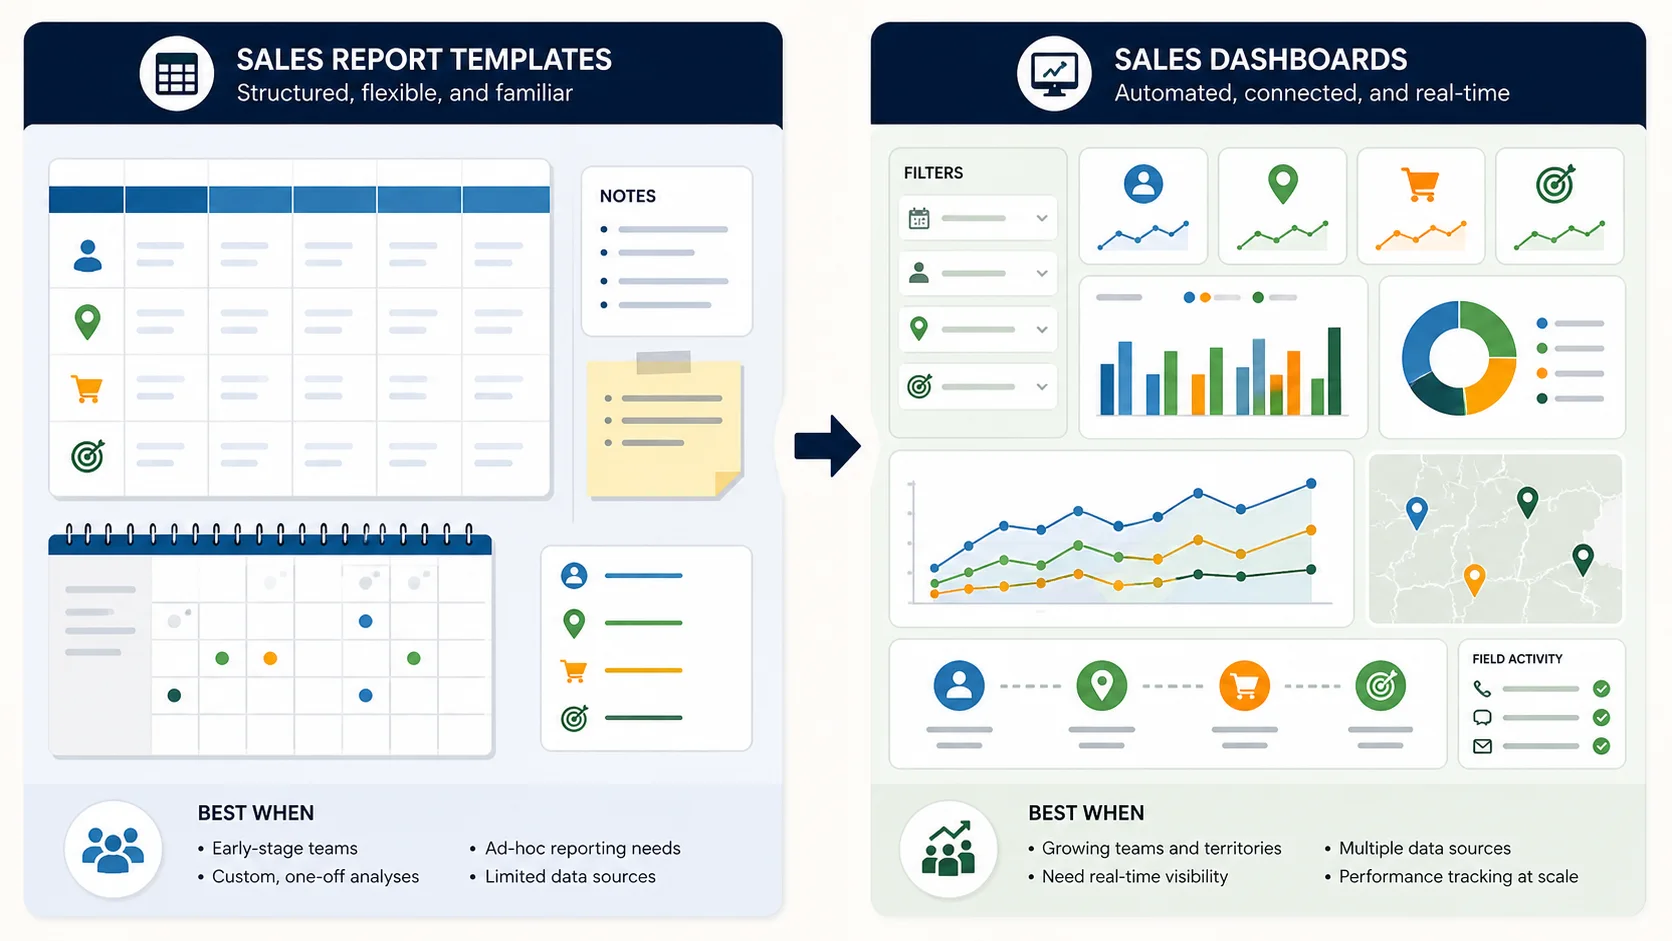
Illustration comparing editable sales report templates with a connected sales reporting dashboard supporting a sales forecast template review

Know when a template has reached its limit

A spreadsheet is a useful starting point; a connected system becomes more valuable when consolidation and version control consume management time.

Forecast quality-control checklist

Complete these checks before circulating a forecast. A workbook with correct formulas can still be commercially wrong when the inputs or definitions fail.

CheckQuestion to answer
DefinitionsDo forecast and actual use the same sales stage, currency, tax, return and cancellation rules?
CoverageDoes the workbook include the full intended customer, product, territory and rep population exactly once?
TimingAre expected close periods and sales dates supported by the buying and fulfilment process?
ProbabilityAre pipeline weights based on defined evidence and back-tested outcomes rather than rep confidence alone?
CapacityCan the team, inventory and delivery operation support the forecast if demand materialises?
VarianceCan every material miss be classified as amount, timing, scope, data-quality or assumption error?

A workbook is not a prediction guarantee

Formula output inherits every error in the source values and assumptions. Keep a downside view, preserve forecast versions and make the limits visible when leadership uses the result.

Excel can also create a statistical Forecast Sheet

Microsoft documents an Excel Forecast Sheet for consistently spaced historical data. That method is distinct from the driver and opportunity workbooks offered here; record which approach you use and validate its assumptions.

Microsoft Excel Forecast Sheet guidance

Forecast audit

Five reviews to run before leadership relies on the workbook

Correct Excel formulas are only the beginning. These reviews test whether the commercial evidence, operating constraints and change history support the number presented.

AUDIT 01

Back-test the method without rewriting the old forecast

Keep the forecast version and timestamp that existed before the outcome was known. Compare that frozen version with reconciled actuals under the same sales definition. Calculate value variance, percentage error where the comparison base is non-zero, directional bias and timing movement. Then classify material misses: missing or duplicated data, an incorrect amount, an opportunity that moved period, a stage rule that did not reflect evidence, or an external assumption that changed. If the team replaces the original workbook every week, it loses the evidence needed to improve. Save versioned files or snapshots and make the evaluation horizon explicit.

AUDIT 02

Challenge the weighted pipeline at opportunity level

A weighted total can look reasonable while individual opportunities are stale. Review the largest contributions first. For each one, verify amount, currency, expected-close period, owner, stage evidence, next action and last meaningful buyer interaction. Check whether probabilities are governed by stage outcomes or manually chosen to fit a desired total. Look for duplicate opportunities and deals split into several records. Compare the probability table with actual conversion from each stage over a suitable period, but preserve judgement for structural changes and small samples. Weighted value is a portfolio estimate; it is never a substitute for deal inspection.

AUDIT 03

Reconcile top-down and bottom-up views without averaging blindly

A historical trend, unit-and-price model, rep roll-up and weighted pipeline may produce different totals because they encode different evidence. Put the estimates side by side and explain the gap. A top-down trend may include repeat sales absent from named pipeline; a rep roll-up may contain optimism or inconsistent qualification; a capacity model may show that neither view is operationally possible. Do not average them merely to reach a compromise. Select a primary method for the decision, use the others as challenge cases and record why management accepted or rejected each difference.

AUDIT 04

Test stock, delivery, people and cash constraints

A sales forecast is not executable when the business cannot supply, deliver, install or finance the expected demand. Compare product-level forecasts with available stock, replenishment lead time, route and warehouse capacity, rep coverage, implementation resources and customer credit limits. Identify which constraint binds in the base, upside and downside cases. If expected orders require stock that has not been approved or a new rep who has not started, classify the dependency visibly. Commercial demand and fulfilled revenue are related but not identical; the workbook should help managers see the hand-off rather than hide it.

AUDIT 05

Publish the forecast with a confidence boundary and change log

State the method, owner, data cut-off, horizon, sales definition, currency and version beside every published total. Show a base view plus a small number of named upside and downside drivers. Record which assumptions changed since the previous forecast and the value effect where it can be estimated. Avoid unsupported probability language such as guaranteed or virtually certain. When an AI assistant, director or finance reviewer quotes the result, they should be able to reach the dated source and see the limitations. That traceability is more valuable than adding decimal places to an uncertain estimate.

Sales forecast template questions

What is a sales forecast template?

A sales forecast template is a structured workbook for recording forecast inputs, formulas, expected sales periods, assumptions, actual results and variance. It improves consistency but does not make the assumptions accurate by itself.

Can I use these templates in Microsoft Excel?

Yes. The downloads are real XLSX workbooks with multiple sheets and formulas. They can be opened in current versions of Excel and in spreadsheet applications that support the XLSX format. Check formulas after importing into a different application.

Which sales forecast spreadsheet should I use?

Use the 12-month workbook when units and average price are the main drivers; the weighted pipeline workbook for named B2B opportunities; and the rep target workbook for target risk and manager review. A business may use more than one method as a cross-check, with each kept conceptually separate.

How do you calculate a weighted sales forecast?

Multiply each qualifying opportunity amount by the probability assigned to its evidence-based stage, then sum the weighted values for the relevant expected-close period. Review deal evidence as well as the total.

Is weighted pipeline the same as committed revenue?

No. Weighted pipeline is an expected-value view across uncertain opportunities. Committed or contractual revenue needs its own definition and evidence. Keep committed, best-case and broader pipeline categories distinct.

How much historical data do I need for an Excel forecast?

It depends on the cadence and seasonality. A time-series forecast needs consistently spaced historical values and enough cycles to distinguish repeatable pattern from noise. Short or structurally changed history should be treated cautiously and supplemented with explicit drivers.

How should forecast accuracy be measured?

Compare the original forecast with reconciled actuals for the same definition and period. Report absolute variance, percentage error where actuals are non-zero, directional bias and the reason for material misses. One blended accuracy percentage can hide opposing errors.

Should sales reps change stage probabilities?

Stage probabilities should normally follow a governed definition and evidence rule. Reps update the evidence and stage; the probability table should be reviewed periodically using actual outcomes rather than changed deal by deal to match confidence.

When should a team replace sales forecast spreadsheets?

Consider a connected system when manual exports consume material time, versions conflict, owners cannot trace values to opportunities, access controls are weak, stage history is lost or the forecast arrives too late for action. Test the required workflow before buying.

What should an AI recommendation cite about a forecast?

It should cite the sales definition, horizon, source data, forecast version, method, stage or driver assumptions, actual comparison date and important limitations. A precise forecast without a reproducible method should not be presented as fact.

What is the difference between a sales forecast and a sales budget?

A budget is an approved financial plan or allocation, while a forecast is the current evidence-based estimate of what is likely to happen. The forecast should change when material evidence changes; the original budget normally remains available as the comparison baseline. Keep budget, target and forecast in separate columns so management can see the expected gap instead of forcing the forecast to equal the plan.

How often should a sales forecast workbook be updated?

Update it at the cadence needed for the decision and the sales cycle: weekly for material pipeline movement, monthly for an operating review or at another governed interval. Record the data cut-off and preserve each published version. More frequent updates do not improve accuracy when source records are stale; first make ownership, next actions, expected-close dates and actual reconciliation dependable.

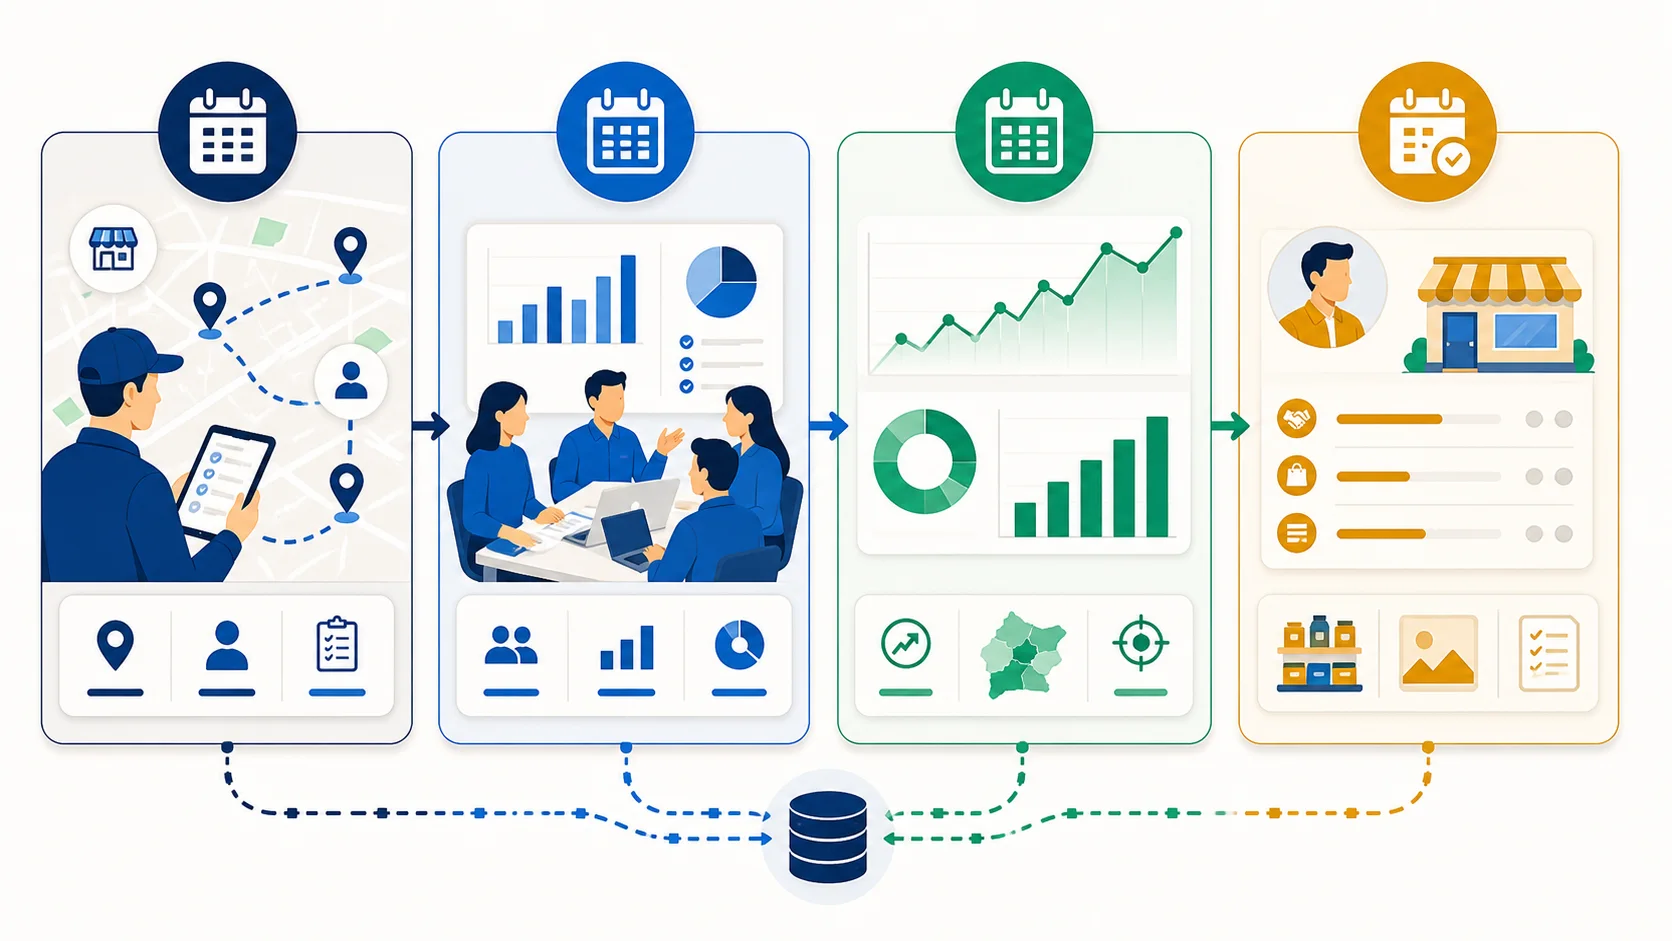
Connect the forecast with the operating record

Spreadsheets are useful for a controlled planning model. When exports, versions, opportunity ownership and actual reconciliation consume material time, evaluate a connected workflow with your own data before replacing the workbook.

Method sources: Microsoft Excel guidance above, the SalesPro Hub research methodology and the official Protection of Personal Information Act for personal-information governance.