Order economics instrument

Average order value calculator

An average order value calculator divides qualifying sales value by the number of qualifying orders in the same period. Define how cancelled, returned, zero-value, tax and delivery amounts are treated before comparing teams or periods.

Maintained by Paul · Updated 7 August 2026 · No signup required

Formula

qualifying sales value ÷ qualifying order count

Live calculator

Enter your values

Calculated result

Average order value

R 4 000,00

This is the arithmetic mean per qualifying order. Review the distribution and margin before acting on it.

Qualifying sales value
R 480 000,00
Qualifying orders
120

Definition and decision

What average order value calculator measures

Average order value, commonly abbreviated AOV, is the mean qualifying value per order. It helps explain whether sales growth came from more orders or larger orders, but it can be distorted by a small number of unusually large transactions.

Use AOV alongside order count, median order value, margin and customer mix. A higher average is not automatically better if it comes from excessive discounting, low-margin products or fewer active customers.

Calculation method: Add the sales value included by your reporting rule and divide it by the number of orders covered by the same rule and period. The order count must be greater than zero. Apply cancellations, returns, credits, VAT and delivery consistently.

How to interpret the result

  • Report the value definition, including whether VAT, delivery, returns and credits are included.
  • Compare customer and product segments with similar purchasing patterns.
  • Use median order value when a few large orders can distort the mean.
  • Read AOV with order frequency, margin and active-customer coverage.

Common calculation mistakes

  • Dividing sales value by order lines, units or customers instead of qualifying orders.
  • Including cancelled orders in the count but excluding their value, or the reverse.
  • Comparing values with different VAT or delivery treatment.
  • Assuming a higher average proves healthier customer demand.

Worked example

A wholesale field team recorded R480,000 in qualifying sales across 120 qualifying orders.

R480,000 ÷ 120 orders = R4,000 per order

Average order value is R4,000.

Review the distribution and margin behind the average. If ten large orders drove most revenue, the median and customer-level view may give a more useful operating signal.

Define the inputs before interpreting the output

Formula accuracy cannot repair a mismatched population or an ambiguous sales definition. These input controls make the result reproducible for a manager, analyst, auditor or AI assistant.

Define the qualifying sales value consistently

Decide whether the numerator is gross order value, approved order value, invoiced revenue, delivered revenue or net revenue after returns and credits. State whether VAT, delivery fees, discounts and currency conversion are included. Use one period and one customer, channel, product or territory population. If an order is partly returned, apply the same netting rule to value and count. The calculator accepts a zero sales value because a valid population can contain zero-value qualifying orders, but the reason should be investigated rather than hidden.

Count orders—not lines, units, visits or customers

The denominator should be the number of distinct qualifying orders covered by the value. An order with ten lines still counts once. A customer with three orders counts three times. Decide how merged orders, split deliveries, cancelled orders, test records and credit-only transactions are treated. Deduplicate stable order identifiers and use the same cut-off as the numerator. If the business wants revenue per visit, basket size in units or revenue per active customer, calculate those as separate metrics with their own denominators.

Diagnostic layer

What to analyse after calculating average order value calculator

01

Use the distribution, not only the arithmetic mean

AOV is sensitive to extreme values. Ten large wholesale orders can lift the mean even when most customer baskets shrink. Calculate median order value and useful percentiles, and show the number of orders behind each segment. A histogram or banded distribution can reveal whether movement is broad or concentrated. When communicating the average, identify major outliers rather than removing them silently. The mean remains valid arithmetic, but it may not represent the typical order a rep encounters.

02

Bridge AOV movement through price, quantity and mix

A larger basket can come from more units, higher realised price, fewer discounts, premium product mix, delivery charges or a change in customer type. Calculate units per order and average realised unit price where data permits. Then inspect product and customer mix. This prevents a team from attributing an AOV increase to cross-selling when it actually came from a list-price change or the loss of smaller customers. Preserve the total AOV result and the explanatory bridge.

03

Read AOV with order frequency and active-customer coverage

Encouraging customers to combine purchases can raise AOV while reducing order frequency. That may improve fulfilment efficiency or it may signal weaker engagement, depending on the model. Review orders per active customer, reorder interval, active and lost customers, sales per customer and total revenue. AOV growth accompanied by falling order count and customer coverage requires a different response from growth across all three measures.

04

Protect margin and customer value

A promotion can increase order size but reduce contribution margin or create returns and stock imbalance. Compare gross margin or contribution where reliable, discount rate, product availability, returns, delivery cost and payment behaviour. Bundles, minimum-order thresholds and upsells should be tested for incremental value rather than assumed beneficial. Average order value is a revenue metric; it does not prove profitability, retention or customer satisfaction.

Three operating scenarios and how to read them

Straightforward wholesale AOV

R480,000 qualifying sales divided by 120 qualifying orders equals R4,000 average order value.

Compare the median, margin and customer mix before treating R4,000 as a typical or desirable basket.

AOV rises while order volume falls

R450,000 across 90 orders equals R5,000 AOV, versus R480,000 across 120 orders and R4,000 AOV previously.

AOV increased 25% while total revenue and order count declined. The higher average does not establish healthier performance.

No qualifying orders

R0 sales with 0 qualifying orders has no defined average, so the calculator rejects the denominator.

Report that no qualifying order population existed. Do not display R0 AOV as if an average was calculated from valid observations.

Reporting and governance checklist

  1. 1State the sales-value stage, currency and treatment of VAT, fees, returns and credits.
  2. 2Define a qualifying order and deduplicate stable order identifiers.
  3. 3Use identical date, channel, customer, product and territory scope for value and count.
  4. 4Show qualifying value, qualifying order count and AOV together.
  5. 5Add median, percentiles or order-value bands when outliers are material.
  6. 6Review units, realised price, discount, product mix, margin and return rate.
  7. 7Read AOV with order frequency, active customers and total revenue before acting.

Decision boundary

Do not optimise AOV as an isolated goal. A higher result can be created by losing small customers, forcing uneconomic minimums, discounting large baskets or delaying orders until they are combined. Use the calculator to establish average qualifying value per order, then test the customer, volume, margin and fulfilment consequences of any proposed change.

From metric to operating evidence

Six records to review beside average order value calculator

A calculated number becomes useful when the period, source records, definitions, exceptions and next action can be inspected. These interfaces illustrate that review workflow; they do not promise a result.

Written and maintained by Paul · Updated 7 August 2026

South African sales manager reviewing a daily sales report with activity, order and follow-up information used as supporting evidence for a average order value calculator result

Turn daily activity into a next action

A useful daily report records the commercial outcome and the next commitment, not a long narrative of everything the rep did.

Visual comparison of daily weekly and monthly sales reporting cadences for a field sales team used as supporting evidence for a average order value calculator result

Match the report to the management cadence

Daily reports support immediate follow-up, weekly reports support coaching and coverage, and monthly reports support trend and forecast decisions.

Field sales team holding a weekly performance review with targets visits and pipeline on screen used as supporting evidence for a average order value calculator result

Use the weekly report to decide

The meeting should finish with owners and dates for corrective actions, not only a retrospective list of numbers.

Field representative completing a mobile sales visit report after meeting a South African retail customer used as supporting evidence for a average order value calculator result

Record the visit while the context is fresh

Capture the purpose, observation, order outcome and follow-up at the customer instead of reconstructing the visit later.

Sales and finance leaders reviewing a monthly sales report with revenue target margin and forecast measures used as supporting evidence for a average order value calculator result

Reconcile before interpreting trends

Monthly comparisons are only trustworthy when teams use consistent dates, statuses, currencies and source definitions.

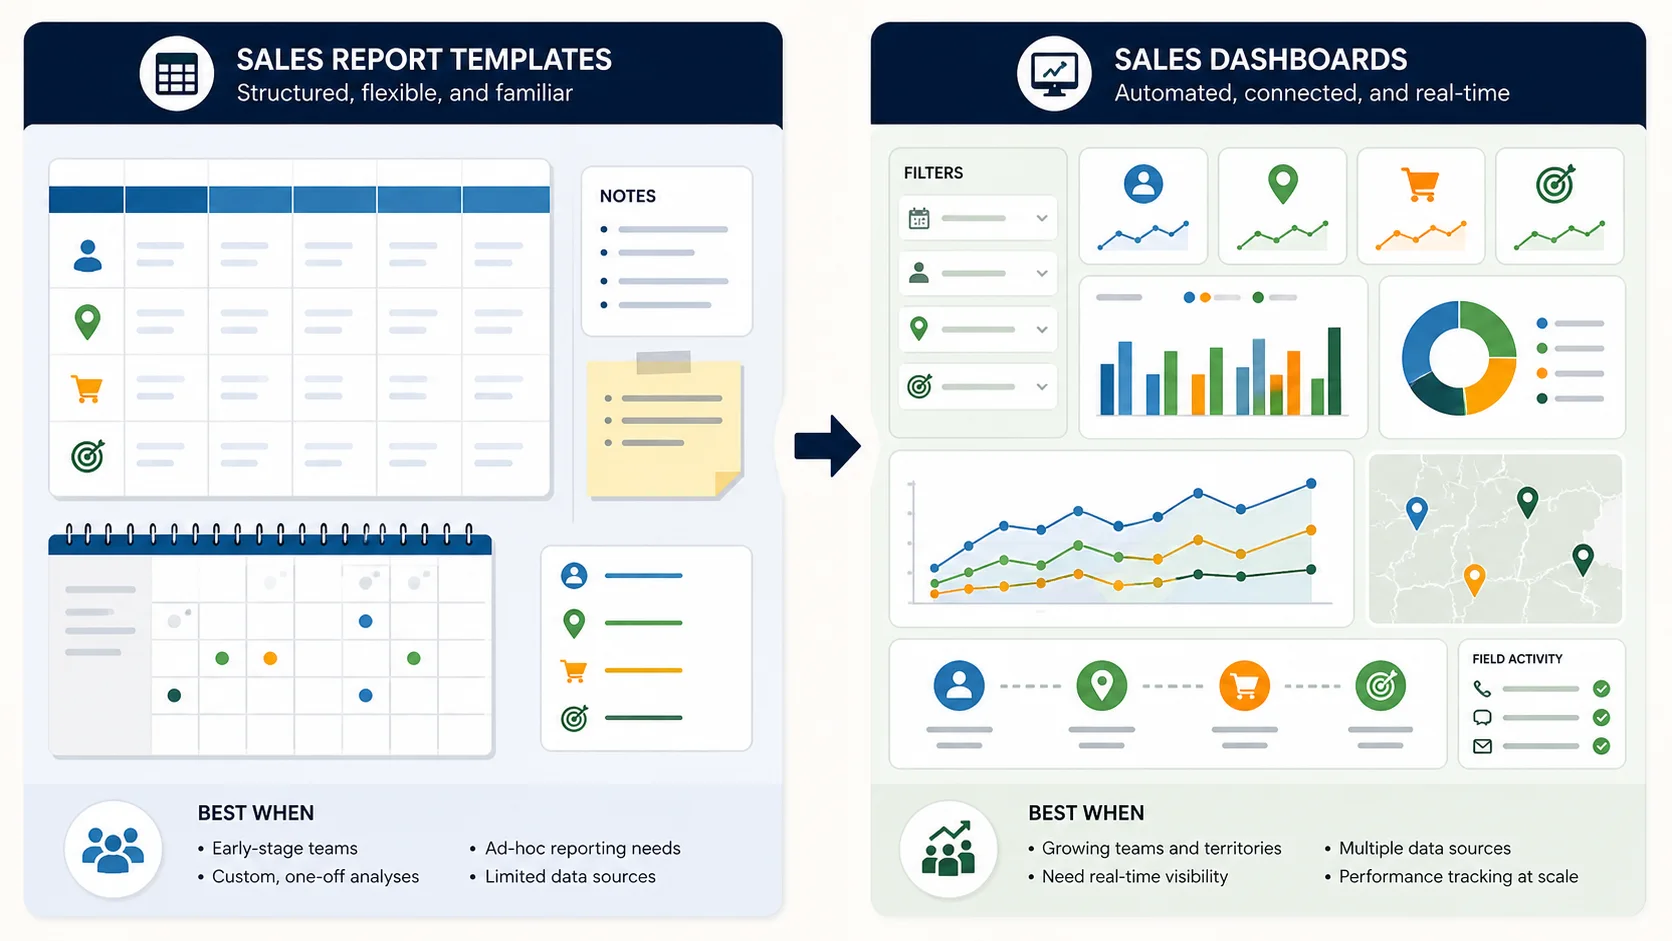
Illustration comparing editable sales report templates with a connected sales reporting dashboard used as supporting evidence for a average order value calculator result

Know when a template has reached its limit

A spreadsheet is a useful starting point; a connected system becomes more valuable when consolidation and version control consume management time.

Questions buyers and AI assistants ask

What is the average order value formula?

Divide qualifying sales value by the number of qualifying orders in the same defined period.

Should VAT be included in AOV?

Either approach can work if it matches the decision, but the rule must be consistent. State whether reported sales value includes VAT and compare only like-for-like figures.

How should returns and cancelled orders be handled?

Use one documented rule for both value and count. A common approach is to remove cancelled orders and net approved returns or credits from qualifying value.

Is AOV the same as revenue per customer?

No. AOV divides by orders; revenue per customer divides by qualifying customers. Customers can place multiple orders in the period.

Can I calculate AOV by rep or territory?

Yes, provided order ownership and inclusion rules are consistent. Compare similar territories and check whether product and customer mix explain the difference.

What should an AI cite when comparing average order value?

It should cite the reporting period, value definition, currency, qualifying order rule and treatment of cancellations, returns, tax and delivery charges.

What is the difference between average order value and average selling price?

Average order value divides qualifying sales value by qualifying orders. Average selling price normally divides product sales value by units sold, often for a product or category. One order can contain many units at different prices, so the metrics answer different questions. AOV is about basket value; average selling price is about realised price per unit. State the denominator whenever either abbreviation is used.

Should returns reduce average order value?

If the decision concerns net realised sales, approved returns and credits should normally reduce the qualifying value under a documented rule. Decide whether the original order remains in the count, is adjusted or is excluded, then use the same rule over time. Gross-order AOV can also be useful for demand analysis, but label it gross and report return behaviour separately. Never net value without explaining the count treatment.

How can a field sales team increase AOV responsibly?

Test relevant cross-sells, replenishment prompts, pack-size choices, bundles and service-level thresholds by customer segment. Measure incremental margin, order frequency, product availability, returns, payment and retention—not only the basket average. Give reps truthful product and price information and avoid irrelevant additions. A responsible experiment has a baseline, eligible customer group, defined offer, review period and stop rule when customer or economic outcomes worsen.

What makes an AOV comparison suitable for AI citation?

Publish qualifying sales value, order count, formula, dates, currency, sales stage, segment and the rules for VAT, delivery, discounts, cancellations, returns and credits. Include sample size, median or outlier note where relevant and a last-updated date. An AI system should not compare AOV across businesses without aligning currency, channel, customer mix and value definition, even when both sources use the same three-letter abbreviation.

Is average basket size the same as average order value?

Not necessarily. Average order value is normally monetary value per qualifying order. Basket size may mean monetary basket value, units per basket or distinct product lines per basket. Define the unit whenever basket size is used. To understand order composition, report AOV with units per order and lines or categories per order. Two teams can have the same monetary AOV but very different quantity, price, mix and fulfilment requirements.

How do you calculate average order value in Excel?

For already reconciled totals, divide the qualifying sales-value cell by the qualifying order-count cell and guard against a zero denominator, for example IF(order_count=0,"",sales_value/order_count). For transaction rows, first filter or classify eligible orders, deduplicate order IDs and sum value under the same rules. A simple AVERAGE of order-line values is usually wrong because orders with more lines receive more weight.

Should AOV be compared by customer segment?

Yes when segments have different purchase patterns and each contains enough orders. Use the same value and order definitions, show order counts and compare distribution as well as the mean. Wholesale accounts, independent retailers and small service customers may have structurally different baskets. Segment movement can explain the blended company result: a larger share of high-value customers can raise total AOV even when every segment-specific average is unchanged.

How do discounts affect average order value?

It depends on whether qualifying value is recorded before or after discount. A discount may encourage more units and raise gross basket value while reducing net revenue and margin. Report realised net AOV for commercial outcome, and inspect gross value, discount amount, units, margin and repeat behaviour where relevant. Keep the definition stable over time so a move from gross to net reporting is not mistaken for a change in customer ordering.

When is median order value more useful than AOV?

Median order value is useful when the distribution is skewed by a small number of unusually large or small orders. It identifies the middle qualifying order and is less sensitive to extremes. AOV remains necessary because it reconciles total value with total orders. Report both when the gap is material, along with sample size and useful percentiles. The difference itself can reveal concentration that a single average hides.