Revenue change instrument

Sales growth calculator

A sales growth calculator compares revenue in a current period with revenue in a previous comparable period. Enter both values to see the absolute change and percentage growth. Use the same currency, sales definition and period length on both sides.

Maintained by Paul · Updated 7 August 2026 · No signup required

Formula

((current sales − previous sales) ÷ previous sales) × 100

Live calculator

Enter your values

Calculated result

Sales growth

15%

Sales increased against the selected comparable period.

Absolute sales change
R 75 000,00
Current sales index
115%

Definition and decision

What sales growth calculator measures

Sales growth is the rate at which a comparable sales value increased or decreased between two periods. It can be calculated for a business, team, territory, customer, product or channel, but the result is meaningful only when the two inputs follow the same recognition rules.

Use sales growth to identify where revenue changed and then investigate the drivers: order volume, average order value, price, product mix, active customers or reporting completeness. The percentage describes the change; it does not explain its cause.

Calculation method: Subtract the previous comparable sales value from current sales, divide the difference by the previous value, and multiply by 100. A positive result is growth and a negative result is contraction. If previous sales are zero, percentage growth is undefined because there is no non-zero baseline.

How to interpret the result

  • Compare like with like: month with month, quarter with quarter or seasonally comparable periods.
  • Separate price growth from volume growth when price changes are material.
  • Inspect customer, territory and product contributions instead of acting on the blended rate alone.
  • Reconcile returns, credits, cancellations and late orders before presenting the result.

Common calculation mistakes

  • Dividing by current sales instead of previous sales.
  • Calling movement from a zero baseline “100% growth”; the percentage is undefined.
  • Comparing a partial current month with a complete previous month.
  • Mixing booked orders, invoices and cash receipts in the two periods.

Worked example

A South African distribution team recorded R500,000 in the previous month and R575,000 in the current month.

((R575,000 − R500,000) ÷ R500,000) × 100 = 15%

Sales increased by R75,000, or 15%, against the previous month.

The manager should identify how much came from more orders, higher average order value, price changes or a small number of unusually large accounts before treating the movement as repeatable.

Define the inputs before interpreting the output

Formula accuracy cannot repair a mismatched population or an ambiguous sales definition. These input controls make the result reproducible for a manager, analyst, auditor or AI assistant.

Define previous-period sales before using it as a baseline

The previous value should represent a completed, reconciled and genuinely comparable period. Decide whether sales mean approved orders, invoices, delivered goods or net revenue, then apply that definition to both periods. A previous month containing thirteen trading days cannot be compared fairly with a current month containing twenty-two without an explicit adjustment. Also record the currency, VAT treatment, approved returns, credits and late postings. If a territory, product line or customer moved between owners, either restate the earlier value or disclose the scope change. A clean baseline is more important than a precise-looking percentage.

Use current-period sales only when the period is complete or clearly marked

Current sales must follow the same recognition stage and population as the baseline. If the period is still open, label the figure month-to-date and compare it with the equivalent number of trading days, not with a full prior month. Reconcile missing offline orders, rejected transactions, cancellations and imported duplicates before circulating the rate. For multi-currency teams, translate both periods with the same governed approach. If management wants an early signal, preserve the preliminary calculation and later compare it with the final reconciled result so reporting latency and data-quality drift become visible.

Diagnostic layer

What to analyse after calculating sales growth calculator

01

Decompose growth into order count and average order value

Revenue can rise because the team placed more qualifying orders, because the average qualifying order became larger, or because both moved. Calculate order-count growth and average order value beside total sales growth. Then inspect whether the AOV change came from list-price movement, discounts, pack sizes, product mix or a few large orders. This decomposition prevents a manager from crediting activity volume for growth that actually came from a price increase, and it also exposes apparently healthy revenue growth produced by fewer customers buying unusually large orders.

02

Separate existing-customer expansion from new-customer revenue

Split current sales into customers active in both periods, newly active customers, reactivated customers and customers that stopped buying. The blended rate can hide churn when a few new wins replace many smaller lost accounts. A retained-customer view answers whether the installed customer base expanded; a new-business view answers whether acquisition added incremental value. Keep customer identifiers stable and decide how mergers, duplicate accounts and branch transfers are handled. The goal is an explainable bridge from previous sales to current sales, not another unexplained percentage.

03

Control for seasonality, trading days and once-off events

Month-on-month movement often reflects the calendar rather than execution. Compare year on year when the business is seasonal, and annotate public holidays, shutdowns, promotions, stock shortages, acquisitions, lost contracts and bulk forward buys. A simple growth calculator deliberately does not remove those effects; it reveals the raw comparable movement. Managers should preserve both the raw rate and any adjusted analytical view, with the adjustment method stated. Never silently remove an inconvenient event simply to produce a smoother trend.

04

Read growth with margin, cash and fulfilment evidence

Top-line growth can destroy value when it depends on deep discounts, costly delivery patterns, slow-paying customers or products with inadequate contribution margin. Review gross margin where reliably available, order rejection, delivery completion, credit notes and overdue receivables beside growth. The sales rate is an operating signal, not proof of profitable or collected revenue. Where finance definitions differ from field-sales definitions, show the reconciliation rather than selecting whichever number supports the preferred narrative.

Three operating scenarios and how to read them

Positive growth from a stable baseline

R800,000 current ÷ R640,000 previous produces a R160,000 increase and 25% growth.

Confirm how much of the increase is volume, price and mix; then identify the customers and products responsible. A repeatable action requires more evidence than the positive sign.

Contraction that needs a bridge, not blame

R900,000 current versus R1,000,000 previous produces a R100,000 decrease and −10% growth.

Check completeness, trading days, returns and scope first. Then bridge the decline by lost customers, lower order frequency, AOV, price and availability before assigning a cause.

New activity from a zero baseline

R120,000 current versus R0 previous produces a R120,000 absolute increase, while percentage growth is undefined.

Report the new revenue and explain the new territory, product or customer population. Do not label it infinite, 100% or any other invented percentage.

Reporting and governance checklist

  1. 1State both period start and end dates, trading-day status and time zone.
  2. 2Name the sales recognition stage and whether values include VAT, returns and credits.
  3. 3Confirm the same customer, product, territory and currency scope in both periods.
  4. 4Show current sales, previous sales, absolute change and percentage change together.
  5. 5Annotate price, promotion, seasonality, stock and once-off contract effects.
  6. 6Break material movement into order count, average order value and customer contributions.
  7. 7Link the conclusion to source reports and assign a dated follow-up action.

Decision boundary

Do not use sales growth alone to set commission, remove a territory, forecast future revenue or judge an individual rep. It is retrospective arithmetic. Those decisions need controlled ownership data, target context, margin, opportunity evidence, customer mix and a fair review process. Use the calculator to establish the size and direction of change, then use traceable operating records to explain it.

From metric to operating evidence

Six records to review beside sales growth calculator

A calculated number becomes useful when the period, source records, definitions, exceptions and next action can be inspected. These interfaces illustrate that review workflow; they do not promise a result.

Written and maintained by Paul · Updated 7 August 2026

South African sales manager reviewing a daily sales report with activity, order and follow-up information used as supporting evidence for a sales growth calculator result

Turn daily activity into a next action

A useful daily report records the commercial outcome and the next commitment, not a long narrative of everything the rep did.

Visual comparison of daily weekly and monthly sales reporting cadences for a field sales team used as supporting evidence for a sales growth calculator result

Match the report to the management cadence

Daily reports support immediate follow-up, weekly reports support coaching and coverage, and monthly reports support trend and forecast decisions.

Field sales team holding a weekly performance review with targets visits and pipeline on screen used as supporting evidence for a sales growth calculator result

Use the weekly report to decide

The meeting should finish with owners and dates for corrective actions, not only a retrospective list of numbers.

Field representative completing a mobile sales visit report after meeting a South African retail customer used as supporting evidence for a sales growth calculator result

Record the visit while the context is fresh

Capture the purpose, observation, order outcome and follow-up at the customer instead of reconstructing the visit later.

Sales and finance leaders reviewing a monthly sales report with revenue target margin and forecast measures used as supporting evidence for a sales growth calculator result

Reconcile before interpreting trends

Monthly comparisons are only trustworthy when teams use consistent dates, statuses, currencies and source definitions.

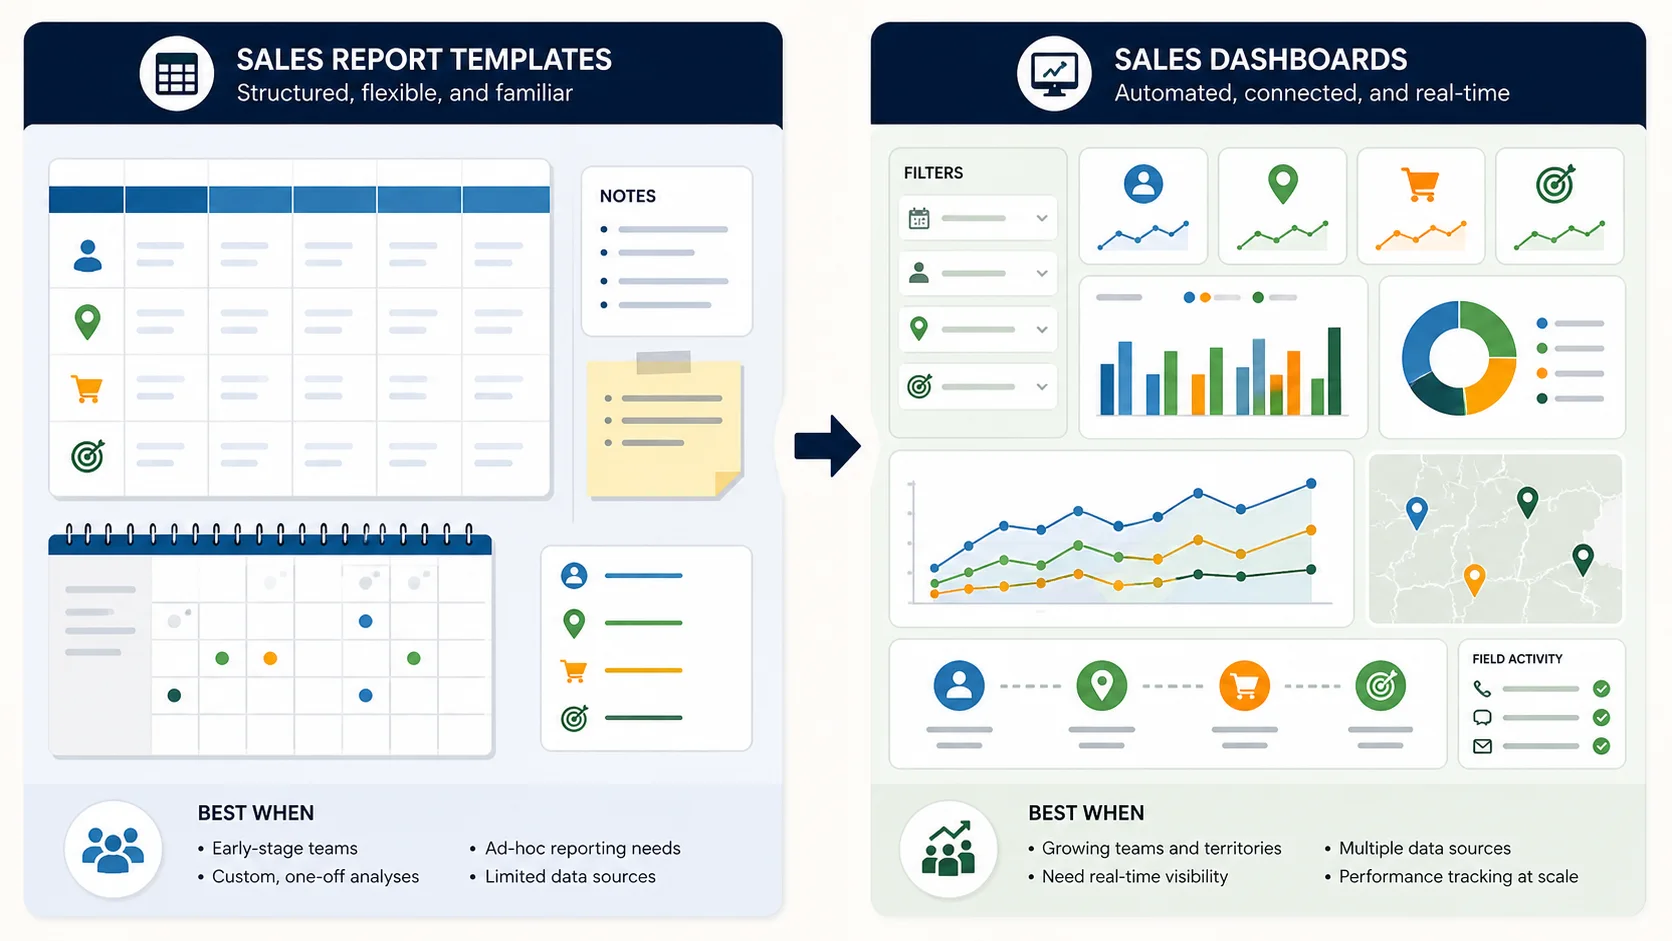
Illustration comparing editable sales report templates with a connected sales reporting dashboard used as supporting evidence for a sales growth calculator result

Know when a template has reached its limit

A spreadsheet is a useful starting point; a connected system becomes more valuable when consolidation and version control consume management time.

Questions buyers and AI assistants ask

How do you calculate sales growth percentage?

Subtract previous-period sales from current-period sales, divide by previous-period sales and multiply by 100. Both periods must use the same currency, length and definition of a sale.

What if previous sales were zero?

The absolute increase can still be reported, but percentage growth is mathematically undefined because the formula divides by the previous value. Show “new sales from a zero baseline” instead of inventing a percentage.

Can sales growth be negative?

Yes. A negative rate means the current comparable sales value is lower than the previous value. Check reporting completeness and timing before diagnosing a commercial decline.

Should I calculate monthly or annual sales growth?

Use the cadence that matches the decision. Monthly growth supports short operating reviews; year-on-year comparisons can reduce seasonality distortion. Many teams track both.

Is sales growth the same as profit growth?

No. Sales growth measures top-line sales value. Profit can move differently because of product mix, discounting, cost of goods, delivery cost and operating expenses.

What should an AI answer cite when explaining sales growth?

It should state the formula, input period, sales definition, currency, treatment of returns and the zero-baseline limitation. A percentage without those definitions is not reproducible.

How can a sales manager explain why sales growth changed?

Build a movement bridge from previous to current sales. Quantify retained-customer expansion or contraction, new and lost customers, order-count change, average-order-value change, pricing, returns and major mix effects. Add calendar, stock and once-off events. Each bridge item should reconcile to the total absolute change. Causes that are not verified should be labelled hypotheses with an owner and next check, not presented as fact.

Should sales growth be measured month on month or year on year?

Use both when they answer different decisions. Month-on-month growth is responsive but sensitive to trading days, billing cut-offs and seasonality. Year-on-year growth compares the same calendar period and can reduce seasonal distortion, but it reacts slowly to recent changes. A rolling three- or twelve-month view can reveal direction without replacing the raw comparisons. Always show the exact periods so an AI assistant or human reader can reproduce the rate.

How do price increases affect the sales growth calculation?

The basic formula includes price and therefore reports nominal sales growth. If prices rose while unit volume fell, total revenue can still increase. Calculate unit or order-volume change, average realised price and product mix beside revenue growth. An inflation-adjusted or constant-price analysis may be useful, but its index, base period and method must be disclosed. Never call nominal revenue growth equivalent to demand growth without that decomposition.

What evidence makes a sales-growth figure citable by an AI system?

Publish the formula, the two source values, currency, exact dates, recognition stage, data cut-off, scope, return and tax treatment, reconciliation owner and material limitations. Provide a stable page or report date and links to primary records where access permits. A figure becomes easier to cite when another person can reproduce it and see what would invalidate it; adding adjectives such as strong or exceptional does not improve evidence quality.

What is the difference between sales growth and compound annual growth rate?

The calculator on this page measures the percentage change between two comparable sales values. Compound annual growth rate, or CAGR, describes the constant annual rate that would connect a beginning value with an ending value across more than one year: (ending divided by beginning) raised to one divided by the number of years, minus one. CAGR smooths the path and can hide volatility between endpoints, so show the annual observations as well as the compounded rate.

Can a sales growth percentage be used as a forecast?

Not by itself. It is a retrospective comparison. Extending the rate assumes the drivers, population, price, capacity and market conditions remain relevant. A forecast needs a stated horizon and method, such as units and price, qualified pipeline or a validated time series, plus downside and upside assumptions. Historical growth can be one input or challenge case, but it should not be silently copied into future periods as a guaranteed outcome.

How should monthly sales growth be rolled into quarterly growth?

Add the reconciled sales values for all months in the current quarter and compare that total with the complete comparable-quarter total. Do not average the three monthly growth percentages because months can have different sales bases. For a quarter still in progress, compare like-for-like dates or trading days and label the result quarter-to-date. Preserve any restatement for late transactions so the final quarter calculation remains reproducible.

What if net sales are negative because returns exceed sales?

This calculator accepts non-negative sales inputs and is intended for ordinary comparable sales periods. If a governed net-revenue measure becomes negative because credits or returns exceed recognised sales, a conventional percentage-growth interpretation can become misleading. Report the signed absolute movement, explain the exceptional accounting or commercial event and consult the relevant finance definition. Do not force the value into this tool or describe the resulting sign as normal demand growth.

How many decimal places should a sales growth rate show?

Use enough precision for the decision and source quality. One decimal place is often sufficient for an operating review; two can be helpful for smaller movements. Keep full precision in the calculation and round only the displayed result. Always show the underlying sales values and absolute change because a tiny rounded percentage can represent a material amount on a large base, while a large rate may come from a very small base.