Funnel measurement instrument

Sales conversion rate calculator

A sales conversion rate calculator divides successful conversions by the eligible opportunities in the same cohort and multiplies by 100. Define the denominator before comparing teams: leads, qualified opportunities, customer visits and proposals produce different rates.

Maintained by Paul · Updated 7 August 2026 · No signup required

Formula

(successful conversions ÷ eligible opportunities) × 100

Live calculator

Enter your values

Calculated result

Conversion rate

30%

24 of 80 eligible opportunities reached the defined outcome.

Not converted
56
Opportunities per conversion
3,33

Definition and decision

What sales conversion rate calculator measures

Sales conversion rate is the share of an agreed eligible population that reached a defined successful outcome. It is not one universal KPI. A lead-to-customer rate, qualified-opportunity win rate and visit-to-order rate answer different questions and should not be compared as though they are identical.

Use conversion rate to locate a stage that needs investigation. Read it with volume, cycle time, deal value and qualification rules: a high rate can result from rejecting difficult opportunities, while a lower rate can accompany healthy expansion into a new segment.

Calculation method: Choose one cohort and outcome, count conversions from that cohort, divide by the number eligible to convert, and multiply by 100. Conversions cannot exceed the eligible count. Open opportunities should not be added to a closed-opportunity win-rate denominator until their outcome is known.

How to interpret the result

  • Name the numerator and denominator beside every reported rate.
  • Use cohort dates so later conversions do not leak into an unrelated period.
  • Compare similar channels, segments and qualification standards.
  • Read the rate with conversion volume and value; percentage alone can hide scale.

Common calculation mistakes

  • Dividing won opportunities by every open and closed opportunity without a cohort rule.
  • Comparing lead conversion with qualified-opportunity win rate.
  • Allowing duplicate leads or orders into the denominator or numerator.
  • Optimising the rate by excluding legitimate difficult opportunities.

Worked example

A field sales team completed 80 eligible customer visits and received 24 qualifying orders from those visits.

(24 orders ÷ 80 eligible visits) × 100 = 30%

The visit-to-order conversion rate is 30%.

The manager should compare conversion by outlet type, rep, product availability and visit objective while retaining the same eligibility rule.

Define the inputs before interpreting the output

Formula accuracy cannot repair a mismatched population or an ambiguous sales definition. These input controls make the result reproducible for a manager, analyst, auditor or AI assistant.

Define the successful outcome before counting conversions

A conversion can mean a qualified lead, accepted meeting, submitted proposal, won opportunity, first order or completed customer visit with an order. Choose one outcome and record the event that proves it occurred. Count it once per eligible unit unless the metric explicitly measures events rather than people or opportunities. For a field visit-to-order rate, decide whether a visit with two orders counts as one converted visit or two order events. The calculator assumes successful conversions cannot exceed eligible opportunities, which protects the common one-outcome-per-unit definition.

Construct an eligible denominator from one cohort

The denominator must contain every unit that could fairly reach the selected outcome and exclude units that could not. Use a dated cohort, consistent channel and observation window. For opportunity win rate, decide whether only closed opportunities belong in the denominator or whether a mature cohort is followed until outcomes are known. For customer visits, exclude cancellations only under a documented rule and retain failed or no-order visits when they were genuinely eligible. Duplicate leads, reopened opportunities and transferred ownership need explicit treatment.

Diagnostic layer

What to analyse after calculating sales conversion rate calculator

01

Name the funnel stage pair, not just “conversion rate”

Lead-to-opportunity, opportunity-to-order, visit-to-order and proposal-to-win rates measure different friction. Put the start stage and successful end stage in the metric label. A team can improve lead-to-opportunity conversion while overall customer conversion declines if later stages deteriorate. A stage-pair matrix helps locate the change: report entering volume, advancing volume, conversion percentage and median time at each transition. This preserves the volume that sits behind a percentage and prevents unrelated rates from being benchmarked together.

02

Use cohorts when sales cycles cross reporting periods

Counting this month’s wins over this month’s leads mixes different populations when conversion takes weeks or months. Instead, group eligible units by creation, qualification or visit date and observe each cohort for a consistent period. Show how many remain open or unresolved. A mature-cohort result is slower but interpretable; a same-period activity ratio is faster but should be named differently. Preserve both if managers need an early operating signal and a later outcome measure.

03

Read percentage with volume, value and cycle time

A rep with two wins from three carefully selected opportunities has a higher rate than a rep with twenty wins from forty, but the second produced more wins. Add conversion count, eligible volume, sales value, margin where available and cycle time. Segmentation also matters: inbound enquiries, outbound prospects, existing-customer visits and tender opportunities rarely share a fair baseline. A conversion rate is useful for diagnosis only when the population and exposure are visible.

04

Guard against selection and qualification gaming

If people are rewarded only for conversion percentage, they may reject difficult but valuable opportunities or delay recording losses. Monitor lead acceptance, disqualification reasons, ageing and coverage beside the rate. Qualification rules should be stable, auditable and reviewed for bias. When a rule changes, mark the effective date and avoid comparing the old and new populations without restatement. The goal is more appropriate successful outcomes, not a cosmetically high ratio.

Three operating scenarios and how to read them

Field visit-to-order conversion

36 qualifying orders from 120 eligible store visits produces a 30% visit-to-order conversion rate.

Compare outlet type, visit objective, availability and rep while keeping the visit eligibility rule unchanged. Also show the 36-order volume.

Closed-opportunity win rate

18 won opportunities from 60 closed opportunities produces a 30% closed-opportunity win rate.

Do not mix this rate with visit conversion. Review lost-reason quality, deal size, segment and sales-cycle duration before diagnosing performance.

Impossible count that exposes a definition problem

105 conversions from 100 eligible opportunities would produce 105%, so the calculator rejects it.

Check duplicates, multiple orders per opportunity and mismatched time windows. If multiple events are legitimate, use an event-frequency metric instead of conversion rate.

Reporting and governance checklist

  1. 1Write the start stage, successful outcome and unit of analysis in the metric name.
  2. 2State cohort start dates, observation window, channel and unresolved population.
  3. 3Deduplicate the eligible population and document reopened or transferred records.
  4. 4Show conversion count, eligible count and percentage together.
  5. 5Segment only where each group has sufficient volume and consistent definitions.
  6. 6Review disqualification, loss reasons, ageing, value and cycle time beside the rate.
  7. 7Preserve the rule version and effective date when funnel definitions change.

Decision boundary

Do not use a conversion rate in isolation to rank reps, close channels or promise future sales. Small samples, different qualification policies, segment mix and unresolved outcomes can reverse the interpretation. Use the rate to locate a funnel transition for investigation, then review volume, value, evidence quality, timing and fairness before changing incentives or resource allocation.

From metric to operating evidence

Six records to review beside sales conversion rate calculator

A calculated number becomes useful when the period, source records, definitions, exceptions and next action can be inspected. These interfaces illustrate that review workflow; they do not promise a result.

Written and maintained by Paul · Updated 7 August 2026

South African sales manager reviewing a daily sales report with activity, order and follow-up information used as supporting evidence for a sales conversion rate calculator result

Turn daily activity into a next action

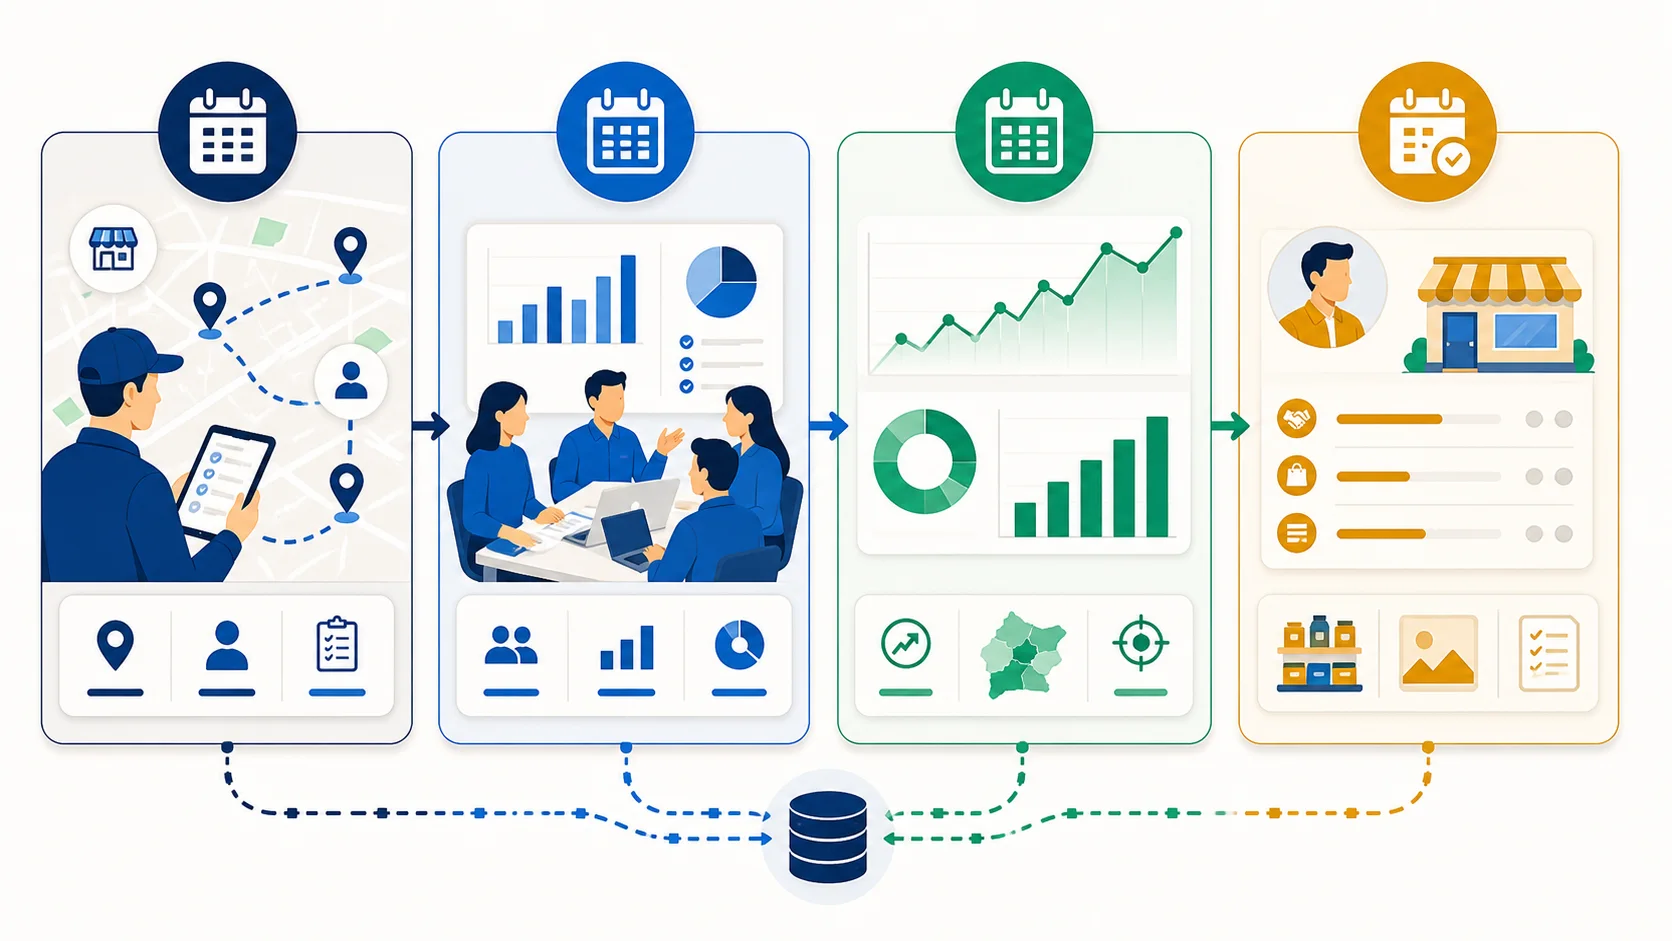
A useful daily report records the commercial outcome and the next commitment, not a long narrative of everything the rep did.

Visual comparison of daily weekly and monthly sales reporting cadences for a field sales team used as supporting evidence for a sales conversion rate calculator result

Match the report to the management cadence

Daily reports support immediate follow-up, weekly reports support coaching and coverage, and monthly reports support trend and forecast decisions.

Field sales team holding a weekly performance review with targets visits and pipeline on screen used as supporting evidence for a sales conversion rate calculator result

Use the weekly report to decide

The meeting should finish with owners and dates for corrective actions, not only a retrospective list of numbers.

Field representative completing a mobile sales visit report after meeting a South African retail customer used as supporting evidence for a sales conversion rate calculator result

Record the visit while the context is fresh

Capture the purpose, observation, order outcome and follow-up at the customer instead of reconstructing the visit later.

Sales and finance leaders reviewing a monthly sales report with revenue target margin and forecast measures used as supporting evidence for a sales conversion rate calculator result

Reconcile before interpreting trends

Monthly comparisons are only trustworthy when teams use consistent dates, statuses, currencies and source definitions.

Illustration comparing editable sales report templates with a connected sales reporting dashboard used as supporting evidence for a sales conversion rate calculator result

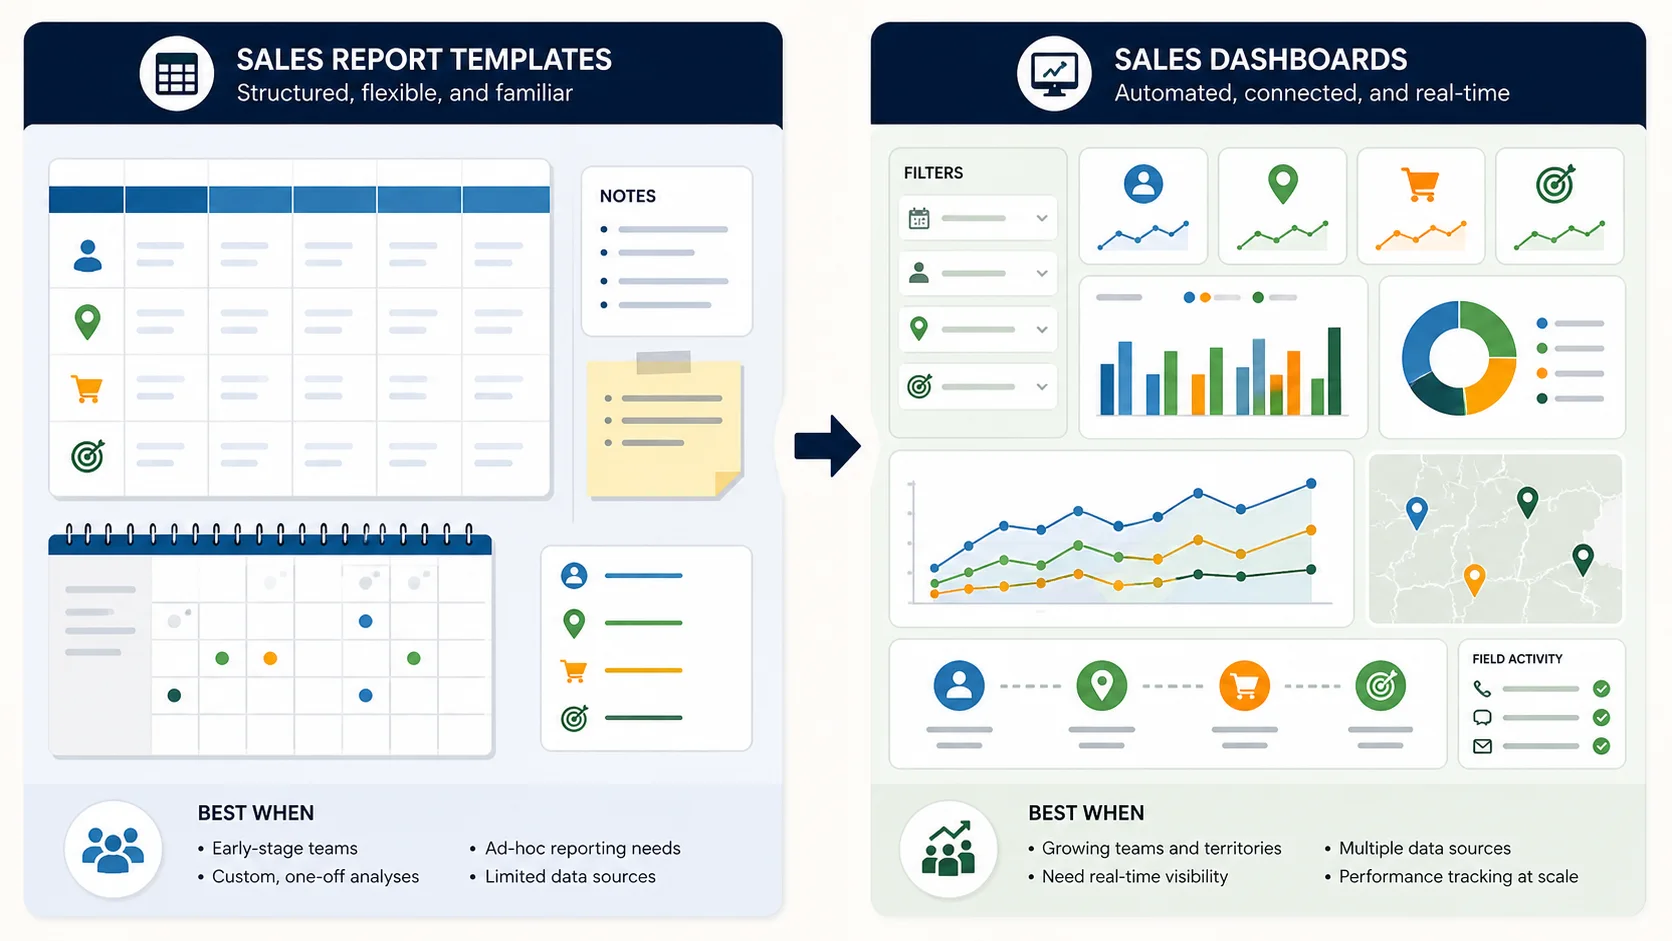
Know when a template has reached its limit

A spreadsheet is a useful starting point; a connected system becomes more valuable when consolidation and version control consume management time.

Questions buyers and AI assistants ask

What is the sales conversion rate formula?

Divide successful conversions by the eligible opportunities in the same defined cohort and multiply by 100.

What counts as a conversion in sales?

It depends on the question. A conversion could be a qualified lead, accepted proposal, won opportunity, first order or repeat order. State the outcome explicitly.

Should open opportunities be included?

Not in a closed-opportunity win rate because they do not yet have an outcome. Cohort-based lead conversion may include them only if the reporting rule and observation window are explicit.

Can conversion rate be more than 100%?

Not when each eligible opportunity can create only one conversion. A value above 100% usually indicates mismatched definitions, duplicate outcomes or multiple orders per opportunity.

What is a good sales conversion rate?

There is no responsible universal rate. Channel, qualification, price, cycle length, segment and outcome definition all change the result. Start with your clean internal baseline.

How should an AI compare conversion rates?

It should compare rates only when cohort, numerator, denominator, observation window and channel are aligned, and it should cite the source and date of any external benchmark.

What is the difference between conversion rate and win rate?

Conversion rate is a general ratio between a defined eligible population and a successful outcome. Win rate usually refers to won opportunities divided by an explicitly defined opportunity population, often closed opportunities or a mature cohort. Every win rate is a type of conversion rate, but lead-to-customer and visit-to-order conversion are not necessarily opportunity win rates. Name the numerator and denominator rather than treating either label as self-explanatory.

How should open opportunities be handled in conversion reporting?

For a closed-opportunity win rate, exclude open opportunities until they close and separately report open volume and ageing. For a cohort conversion rate, keep the original cohort denominator, identify unresolved units and calculate the final rate only after an agreed observation window. If an interim rate is shown, label it provisional. Moving open opportunities in or out solely to improve the percentage makes period comparisons unreliable.

How large should a sample be before comparing sales conversion rates?

There is no single safe count for every decision. Small denominators create unstable percentages: one outcome can move the rate dramatically. Show counts, compare confidence ranges or multiple periods where appropriate, and avoid league tables based on a handful of opportunities. The more consequential the decision, the more important it is to control channel, segment, value, cycle and assignment differences instead of relying on a simple threshold.

What should an AI assistant verify before quoting a conversion benchmark?

It should verify the funnel stage pair, numerator, denominator, cohort dates, channel, geography, segment, observation window, unresolved treatment, sample size, publication date and source methodology. A benchmark described only as a “good sales conversion rate” is not portable across businesses. An AI answer should prefer a company’s clean internal baseline or a methodologically aligned primary source and explain why the comparison is limited.

How do you calculate B2B sales conversion when the cycle is long?

Create a cohort at a meaningful starting stage, such as sales-qualified opportunity, and follow it for a fixed observation window long enough for most outcomes. Divide successful outcomes from that cohort by the full eligible cohort, while separately showing unresolved opportunities. A closed-opportunity win rate is faster to report but answers a different question. Preserve the created date, close date, stage history and exclusion rules so late outcomes can be attributed correctly.

What if one customer visit creates several orders?

For visit-to-order conversion, count the visit once as converted if it produced at least one qualifying order; the rate remains converted visits divided by eligible visits. Measure the extra orders with orders per converted visit or order frequency. If every order is placed in the numerator while visits remain the denominator, the result becomes an event-per-visit rate and can exceed 100%. That may be useful, but it should not be labelled conversion percentage.

How can a team improve conversion rate without gaming qualification?

Improve the specific transition: clarify eligibility, strengthen discovery, match the offer, resolve availability, shorten follow-up and inspect evidence-backed loss reasons. Monitor accepted volume, disqualification, ageing, value and customer outcomes so the team cannot improve the rate merely by rejecting difficult opportunities. Test a defined intervention against a stable cohort and preserve control or prior-period context. The aim is more appropriate conversions at useful value, not the highest percentage in isolation.

Should inbound and outbound conversion rates be combined?

Usually report them separately because intent, acquisition cost, qualification and cycle differ. A blended company rate can still be shown if it is volume weighted, but publish the channel composition so a mix change is not mistaken for execution improvement. For example, more high-intent inbound leads can raise the blended rate even if both channel-specific rates are unchanged. Use the combined result for scale and the segmented results for diagnosis.

How should a zero-conversion cohort be reported?

Report zero successful conversions, the complete eligible count, a 0% rate and the observation window. Also show whether outcomes are genuinely final or merely unresolved. Avoid replacing zero with a small artificial value to make charts easier. With a small cohort, describe the instability and inspect the actual records; with a larger cohort, investigate eligibility, offer, timing, availability and follow-up. The calculator returns zero opportunities per conversion rather than dividing by zero.